")
If you’re not tracking performance metrics, it’s nearly impossible to understand what’s really happening at your tennis or pickleball club — and that’s a major risk. Why did court bookings spike in May? Why did memberships drop in July? Why is revenue down despite new programs?
High-impact metrics like Revenue Per Player (RPP) give you answers — and, more importantly, direction. They don’t just show you what’s happening; they help you understand why it’s happening. And that kind of insight is what turns uncertainty into strategy. It cuts through assumptions and reveals what your club actually needs to grow.
Part 3: How to Measure and Analyze Revenue Per Player (RPP)
Knowing that RPP matters is one thing—making it work for your club is another. In this final part of our RPP series, we’ll show you how to track, break down, and act on your Revenue Per Player. You’ll learn how to turn RPP from a number into a strategy.
Here’s what we cover:
- Why tracking RPP is essential to your club’s growth
- 3 ways to calculate and interpret RPP
- 5 supporting KPIs that round out your revenue picture
By the end, you’ll have a simple system for measuring what matters—and using it to drive smarter, more sustainable growth.
Missed the earlier parts of this series?
Tracking RPP: Why it’s critical for tennis and pickleball club success
Tracking Revenue Per Player (RPP) on a routine basis gives you clear visibility into what’s actually driving your tennis or pickleball club’s revenue. It reveals how effectively you’re monetizing your offerings, how engaged your players are, and where the greatest potential for growth lies.
That’s what makes RPP such a powerful decision-making tool. It not only reflects your club’s current performance, but also shows the financial impact of changes — whether you’re adjusting pricing, launching new clinics, revamping memberships, or expanding services.
By measuring and analyzing how those shifts influence RPP over time, you can make smarter, data-backed decisions that lead to more sustainable growth.
How to measure & analyze RPP: 3 key breakdowns
To start, let’s revisit the core formula for Revenue Per Player:
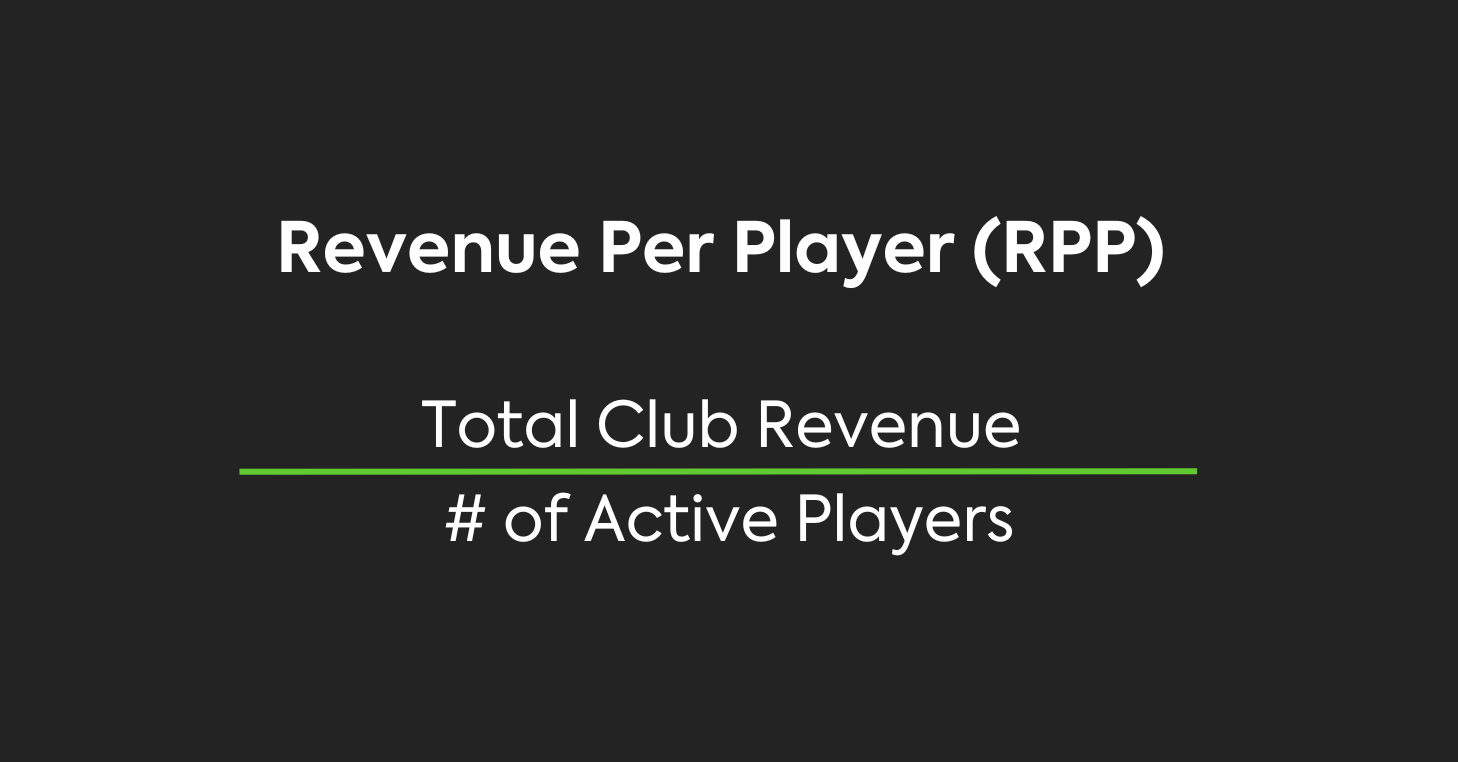
This equation provides a clear, high-level view of how much revenue each player generates for your club. But to turn that insight into action, you need to go further.
What’s driving that number? What’s dragging it down? And where can you make the biggest impact?
Here are three ways to break down and analyze RPP more effectively — so you can identify key trends, uncover opportunities, and strengthen your bottom line.
1. Breakdown by category
A category breakdown reveals how much of your Revenue Per Player comes from specific areas of your club — like memberships, lessons, events, retail, and more.
This transforms RPP from a single number into a layered insight. It shows where your revenue is concentrated, where you might be over-relying on a single stream, and where there’s room to grow. In other words, it highlights which offerings are pulling their weight — and which ones need more attention.
💡 Example
One club ran a category breakdown and realized over 80% of their RPP came from memberships alone. Despite offering lessons and hosting events, participation was low — and those categories weren’t contributing meaningfully to revenue.
This clarity helped them shift focus: they optimized their lesson booking process, added group clinics, and used email promos to drive interest. Over time, lessons and events began pulling their weight — and total RPP rose as a result.
How to calculate:
To calculate Revenue Per Player (RPP) by category, you’ll use the same core formula — just broken down per revenue stream. Here’s how:

Repeat as needed for each major revenue stream at your club.
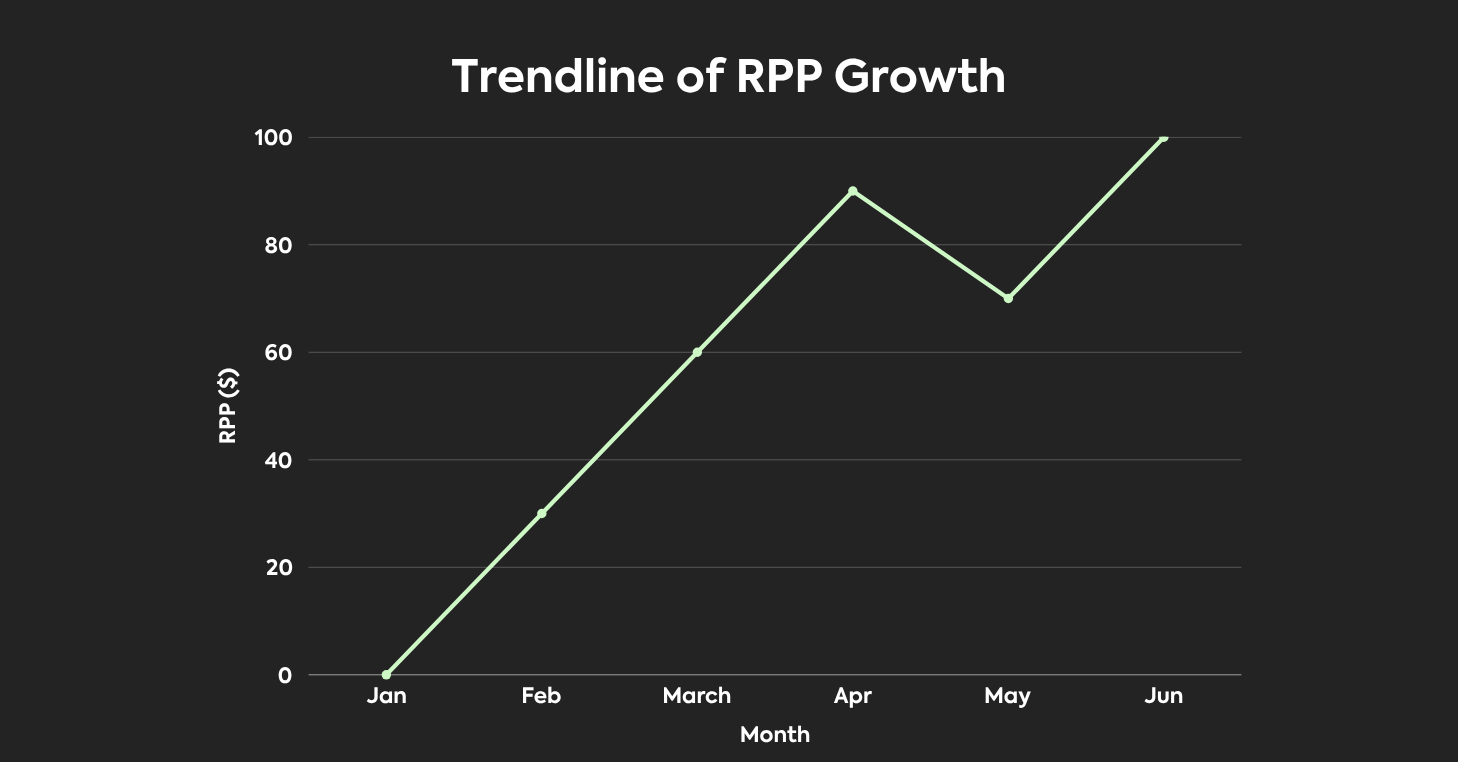
2. Trendline: RPP over time
Looking at your RPP over time reveals how your club’s revenue is evolving, and how operational changes impact your bottom line.
Instead of viewing RPP as a static number, tracking it consistently over time reveals patterns — growth, plateaus, or even dips — that drive smarter decision-making.
This trendline view helps you:
- Monitor the impact of pricing changes, new offerings, or seasonal programs
- Identify dips before they become long-term issues
- Spot spikes tied to successful events, promotions, campaigns, etc.
💡 Example
After introducing a new membership tier in March, one club saw a sharp rise in RPP that held steady through June. But in July, the trendline dipped unexpectedly.
By isolating that period, they realized court cancellations had increased and lesson bookings dropped — likely due to summer travel.
With that insight, they introduced flexible scheduling options and short-term clinics the following summer — keeping engagement high and revenue on track, even during slower months.
How to calculate:
To calculate Revenue Per Player over time, clubs should track the metric across consistent intervals — typically monthly or quarterly.
Start by gathering your total revenue and the number of active players for each period. Then, apply the standard RPP formula and record your results consistently.
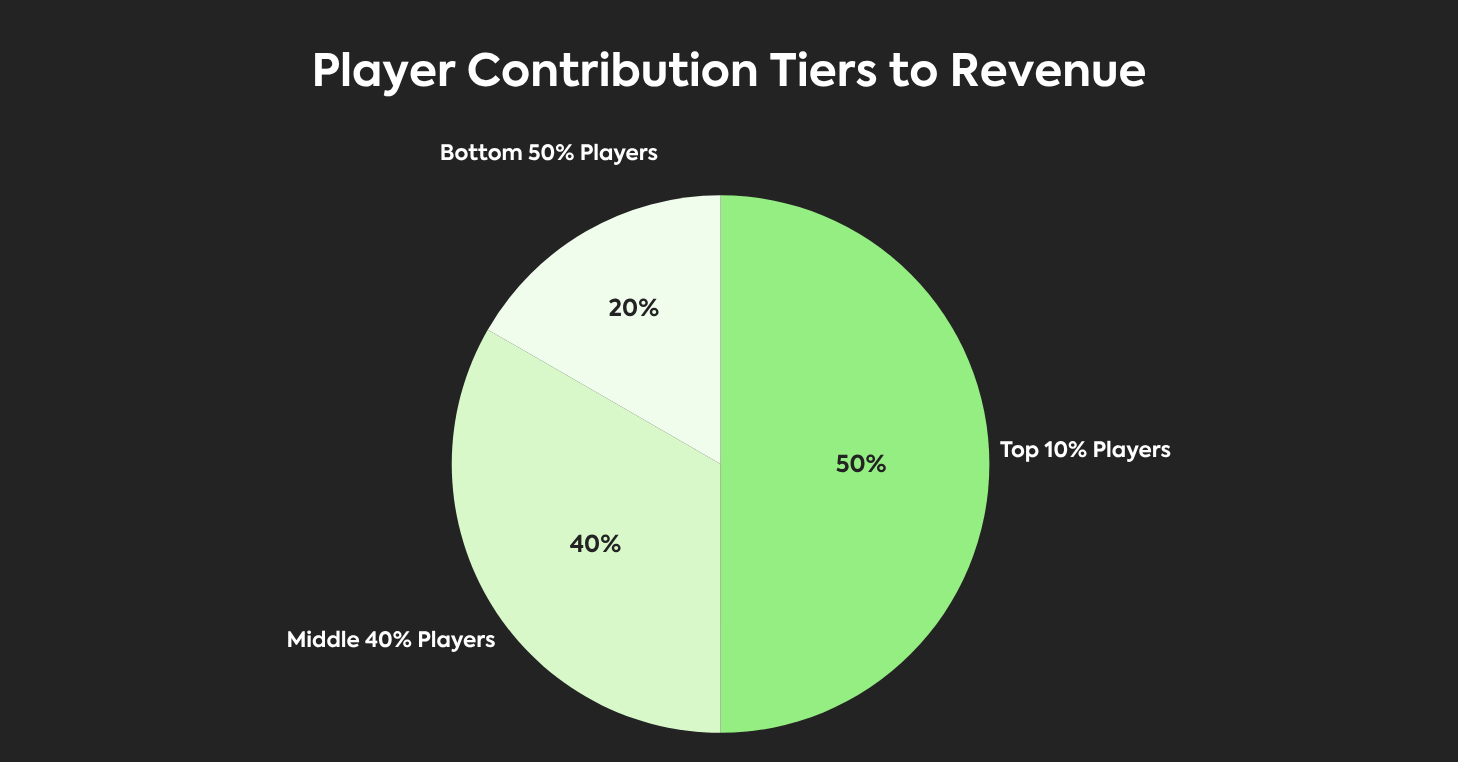
3. Cohort analysis: Segment by player contribution
Not all players contribute to your club in the same way — and a cohort analysis helps you quantify that difference.
In simple terms, it’s a way of grouping players based on their behavior or contribution — typically into top, middle, and bottom tiers — so you can see how revenue is distributed across your player base.
This approach also reveals how engaged each segment of your player base truly is — and how much of your revenue may be concentrated among a small group of high-value players.
If that’s the case, your club may be more exposed to risk than it appears. When too much of your revenue depends on too few players, a single cancellation or shift in behavior — like reduced play, travel, or churn — can have an outsized impact on your bottom line.
To reduce that risk, focus on engaging lower- and mid-tier players with targeted programs: social events, beginner-friendly clinics, or personalized promotions. The goal is to diversify where your revenue comes from — and create more consistent, club-wide participation that supports long-term growth.
💡 Example
One club’s analysis showed that their top 10% of members were responsible for nearly half of all revenue. The remaining 90% engaged less frequently and weren’t contributing much beyond basic dues.
This sparked a change: they rolled out targeted campaigns for low-engagement players — like beginner clinics, social events, and limited-time promos. As more players began participating in multiple programs, overall RPP increased — and revenue became more evenly distributed across their player base.
How to calculate:
Start by pulling a list of active players and their total spending over a specific period. Then, group them into cohorts — such as top 10%, middle 40%, and bottom 50% — and calculate the total and average revenue for each group.
Beyond RPP: 5 other KPIs to track
Revenue Per Player gives you a powerful lens into player value, but it’s just one piece of the performance puzzle. To fully understand and strengthen your tennis and pickleball club’s growth, it’s important to track additional KPIs that highlight member behavior, operational efficiency, and long-term sustainability.
Here are five key metrics to monitor alongside RPP:
Player Retention Rate
While attracting new members is important, keeping the ones you already have is far more cost-effective — and often more profitable.
That’s why Player Retention Rate is an essential metric for racquet clubs to track. It measures the percentage of players who continue to engage with your club over a set period of time.

Routinely tracking this metric allows you to identify patterns and address potential issues before they escalate. A dip in retention could signal that it’s time to refresh your events, rethink communication, or add more value to your memberships.
On the other hand, a high retention rate is a clear sign that your players are happy, engaged, and invested — literally. And the longer they stay, the more they spend, deepening their impact on your revenue and RPP.
In essence, Player Retention Rate serves as a vital health check for your club, highlighting what’s working and pinpointing areas for improvement.
Utilization Rate
Utilization Rate measures how much of your available court time is actually being booked. It’s a key indicator of how effectively you’re using the resources you already have

Tracking this metric regularly helps you spot patterns — which time slots are overbooked, which are underused, and where opportunities exist to increase revenue without having to add more courts.
With this information, you can adjust scheduling, run promotions during off-peak hours, reallocate staff, and so on. Utilization Rate also supports RPP — because when courts are booked more consistently, player value rises too.
In short, this metric helps you make better use of your existing assets — improving access, boosting revenue, and increasing the overall efficiency of your club.
Average Event Attendance
Average Event Attendance gives you visibility into how well your events are performing, based on the average number of players attending each one.

Consistently strong attendance suggests your events are hitting the mark in terms of timing, pricing, and appeal. But if numbers are consistently low, it’s worth reevaluating your strategy — whether that means promoting more effectively, rethinking formats, or testing new event types.
Keeping an eye on this number helps you avoid wasted effort — and ensures your events are contributing to your club’s culture and your bottom line.
Revenue Diversification Ratio
When too much of your revenue depends on a single source, your club becomes more exposed to risk. Whether it’s seasonal churn, shifting member preferences, or one-off disruptions, over-reliance on one stream can quickly impact your financial stability.
Revenue Diversification Ratio measures how your total revenue is distributed across different streams like memberships, court bookings, events, and retail. The goal isn’t just variety — it’s balance.

A healthy diversification strategy not only protects your club against downturns, but also creates more touchpoints for player engagement and delivers more consistent cash flow. Ultimately, this KPI gives you a clearer picture of your revenue ecosystem — helping you scale smarter and build long-term financial sustainability.
Customer Acquisition Cost (CAC)
Customer Acquisition Cost shows how much it really costs your club to gain a new player — factoring in things like marketing spend, promotions, sales time, and onboarding efforts.

While attracting new members is important, unchecked CAC can quietly chip away at your profitability. If you’re spending more to acquire a player than they contribute over time, it’s a sign to re-evaluate your strategy and shift more focus toward retention and engagement.
That’s why CAC works best when viewed alongside other key metrics like RPP, Player Retention Rate, and Lifetime Value. Together, they help you determine whether your acquisition efforts are paying off — and where to adjust for stronger, more consistent returns.
Turning metrics into momentum
Revenue Per Player is more than a number. It reflects behavior, value, and the patterns that shape how your club actually grows. Tracking it gives you a sharper view into what’s working and where attention is slipping. It’s a signal worth following.
RPP lays the foundation for smarter, more intentional club management by grounding your strategy in real behavior: how players engage, where revenue is generated, and where your most impactful opportunities lie. It shows you when to lean in, where to adjust, and how to move forward with purpose.
And when paired with other high-impact KPIs, RPP provides more than operational insights. It gives you a competitive advantage. One that turns day-to-day decisions into meaningful results and transforms data into measurable momentum.
Now you understand RPP.
The next move? What you do with it.