Court revenue, membership pricing, staffing costs, break-even math — these are the decisions that power your racquet and paddle club. If you’re working through them on gut feel or in a spreadsheet you built yourself and half-trust, you’re not alone. That’s just the reality of running a facility where the operational to-do list never gets shorter.
CourtReserve built 12 free calculators and planners to give you something more reliable to work from. Every tool is grounded in real data from 2,200+ active tennis, pickleball, and padel facilities across three areas: Revenue & Pricing, Operations & Planning, and Growth & Launch.
Free to use, no account required, nothing stored. The only thing you need is your numbers.
Below is every tool in the suite and when it’s worth running each one.
- Public Booking Revenue Estimator
- Court Revenue Calculator
- Break-Even Calculator
- Membership Pricing Calculator
- Revenue Per Player Calculator
- Lesson & Clinic Pricing Calculator
- Court Utilization Planner
- Event & Tournament ROI Calculator
- Staffing Cost Calculator
- Membership Growth Projector
- Facility Scorecard
- New Club Launch Checklist
1. Public Booking Revenue Estimator
Opening courts to non-members is one of the highest-return moves you can make. The courts are already there. The demand is already there. Public Booking just connects the two.
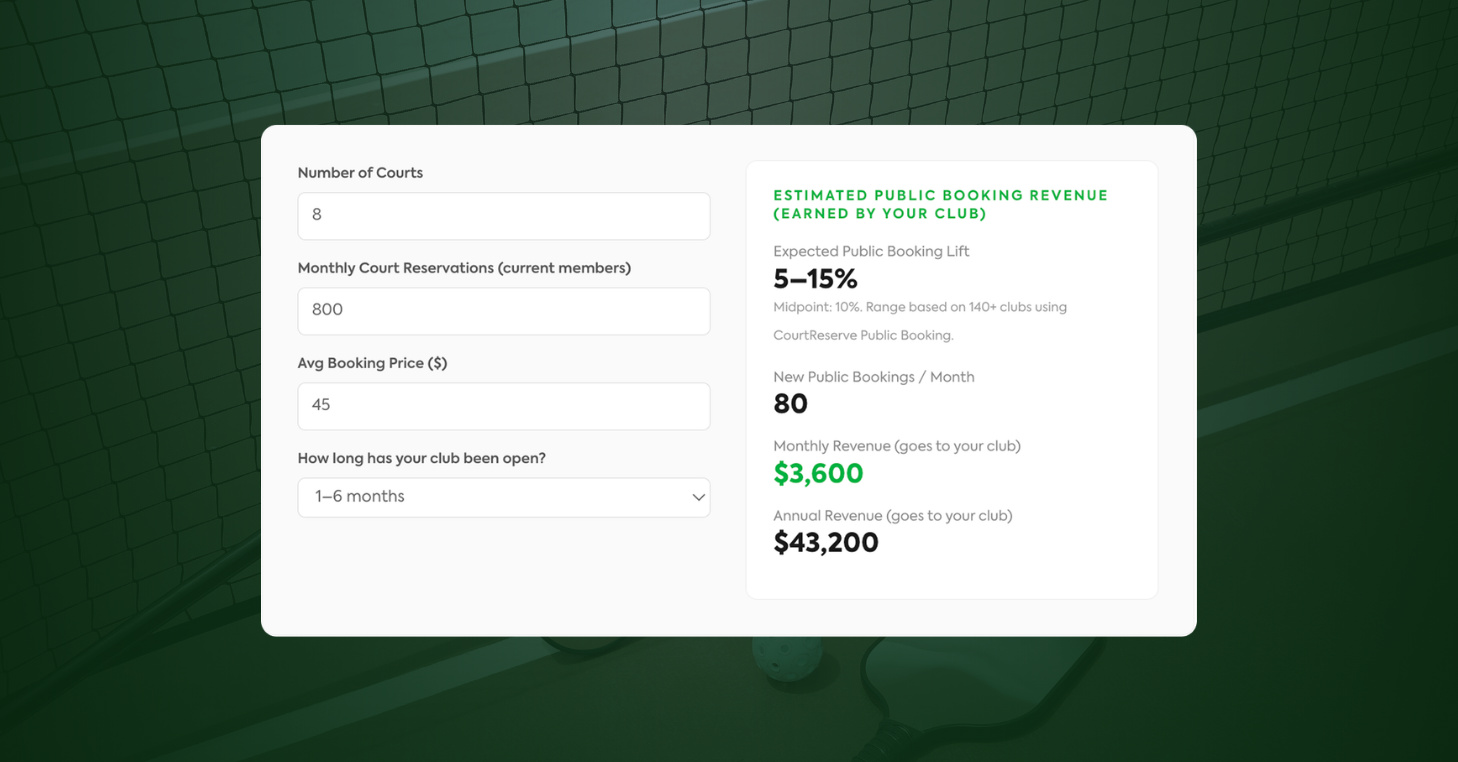
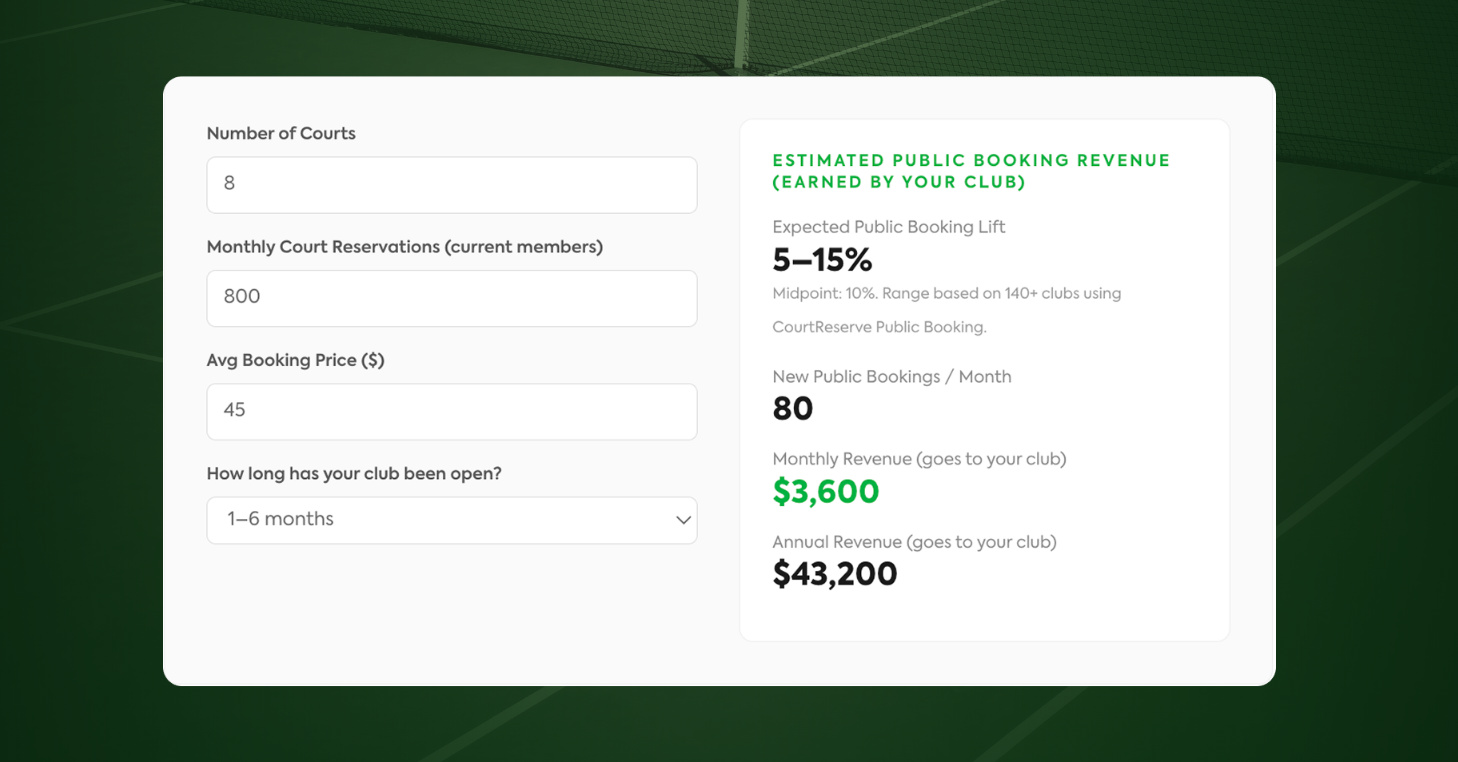
The Public Booking Revenue Estimator puts a real number on what that connection is worth for your specific facility. Plug in your court count, current booking volume, and average booking price, and it outputs monthly and annual projections based on real performance data from 140+ clubs.
Median clubs generate $800–$2,500 per month from public bookings. Top performers clear $5,000–$20,000 monthly. The revenue compounds over time, too. As visibility builds and repeat bookings accumulate, clubs active for 30+ days earn nearly four times more than clubs in their first month.
And because public bookings fill time slots members aren’t using, CourtReserve data shows no decrease in member reservations at clubs that have enabled the feature.
Best for: Clubs considering Public Booking who want a realistic number before committing, and clubs already running it who want to benchmark their performance against similar facilities.
2. Court Revenue Calculator
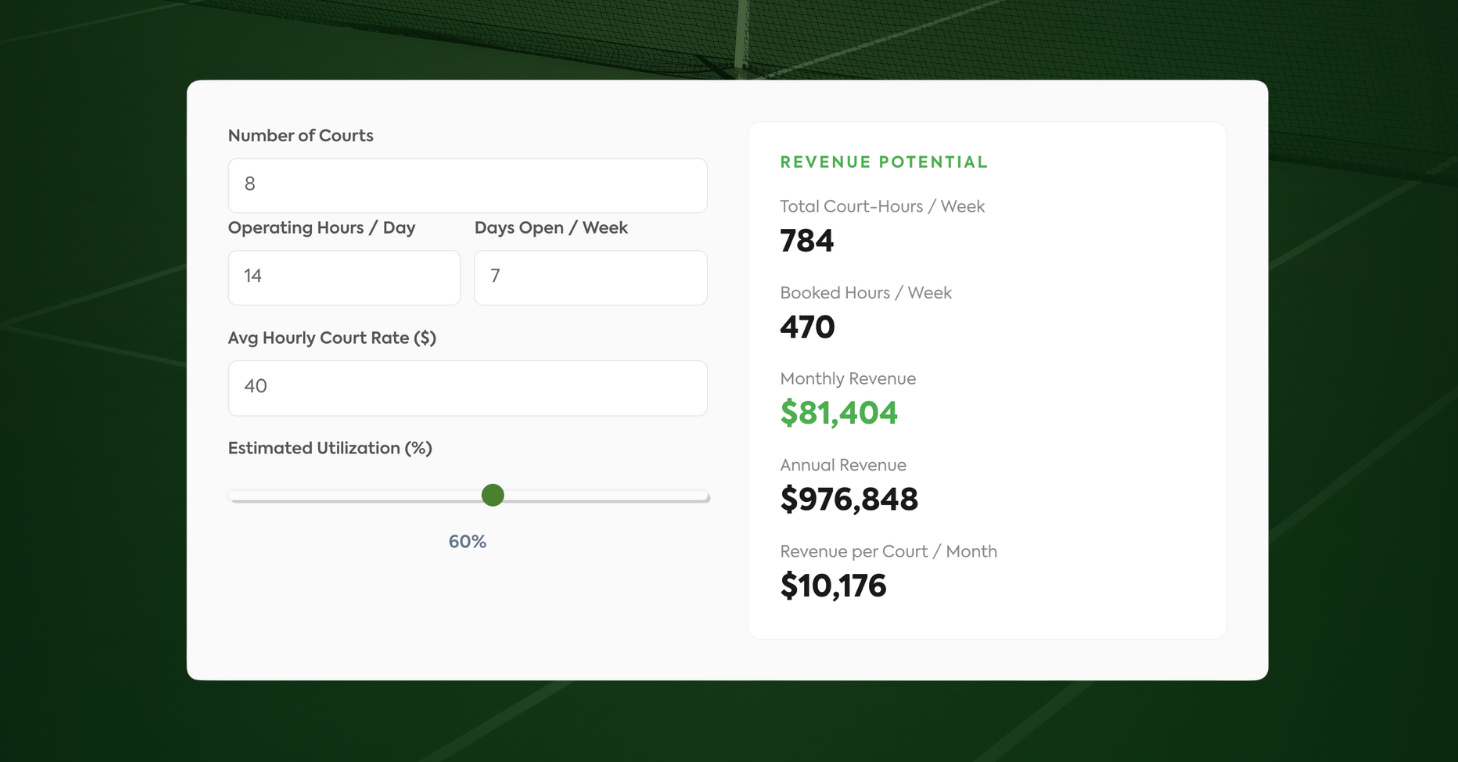
Model your total court revenue by adjusting four inputs in the Court Revenue Calculator: number of courts, operating hours, hourly rate, and utilization. Every variable updates the output in real time. It’s a fast way to pressure-test a rate change, model a new facility, or figure out where your current setup is underperforming.
The utilization lever tends to surprise operators the most. On an eight-court facility charging $40 per hour, a 10% utilization improvement is worth more than $77,000 annually. Same courts, better fill rate, meaningfully different outcome.
The calculator also benchmarks your inputs against real facility data. Indoor pickleball utilization typically runs 55–75% during peak hours and 25–40% off-peak. If your off-peak is consistently sitting below 25%, that’s the gap worth closing first — Public Booking and event programming are usually the fastest way to get there.
Best for: Any operator modeling court revenue, whether you’re planning a new facility, evaluating a rate adjustment, or trying to understand where your courts are underperforming.
3. Break-Even Calculator
Rent, insurance, staffing, and loan payments. The costs are already running before a single member walks through the door. That’s your break-even point, and every hiring decision, pricing call, and growth target flows from it.
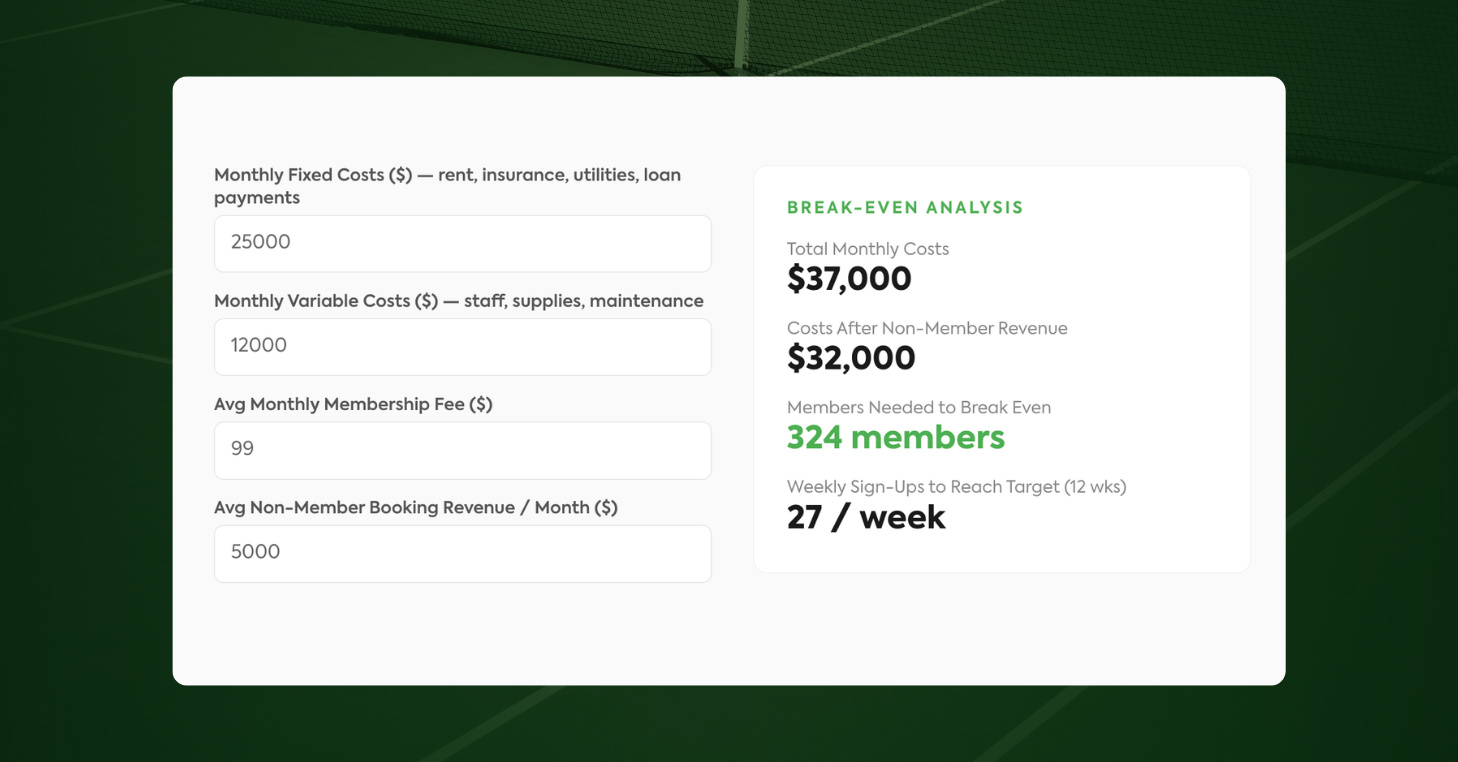
Fill in your fixed costs, variable costs, average membership price, and non-member revenue into the Break-Even Calculator, and it outputs exactly how many members you need to cover your expenses. A club generating $5,000 a month from public bookings, for example, needs 50 fewer members at $99 a month to reach that line. That changes how you think about hiring, pricing, and when growth actually becomes affordable.
From real data across CourtReserve facilities, small clubs tend to break even between 150–250 members, with mid-size clubs landing closer to 250–450. A useful reference point for knowing whether your current trajectory is on track.
Best for: New club operators building their financial model, and established clubs stress-testing a pricing change or a new hire.
4. Membership Pricing Calculator
Membership pricing is one of the few decisions that compounds over time. A small change in tier structure, like a $10 price adjustment, a better-defined premium tier, and a rebalanced member mix, can be worth thousands of dollars a month without adding a single new member.
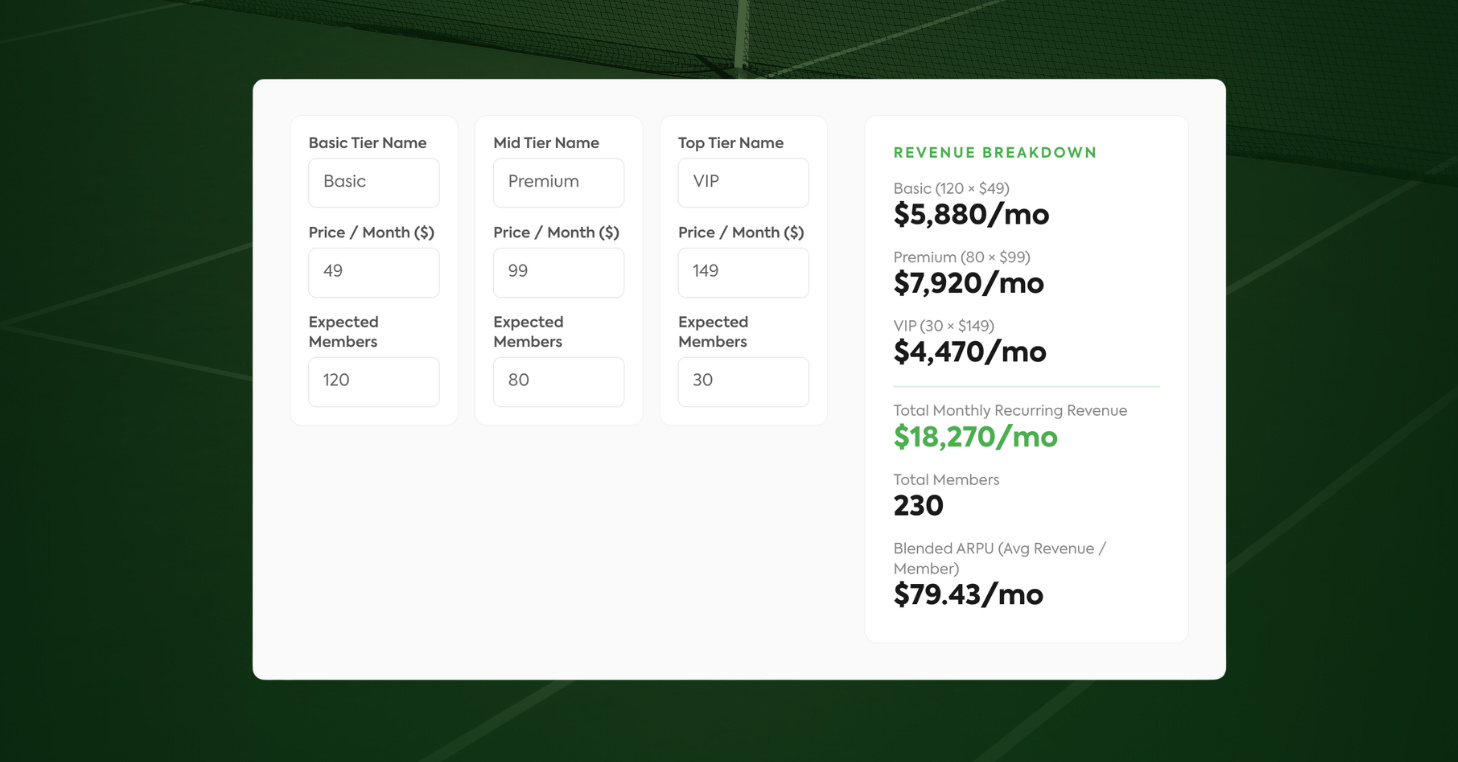
That’s why getting the structure right before locking it in matters. Set the name, price, and expected member count for up to three tiers in the Membership Pricing Calculator. The output covers your total monthly recurring revenue, blended average revenue per member, and how your revenue is distributed across tiers.
Across the CourtReserve network, the strongest clubs generate 50–60% of membership revenue from their mid-tier, with the remaining split fairly evenly between basic and premium. A structure that’s too bottom-heavy usually signals a pricing or positioning problem worth investigating.
Best for: Clubs launching memberships for the first time, and established clubs that suspect their current tier structure isn’t pulling its weight.
5. Revenue Per Player Calculator
Membership revenue is only part of what a player is worth to your club. The rest comes from lessons, clinics, events, leagues, and ancillary spend like food, beverages, and pro shop sales.
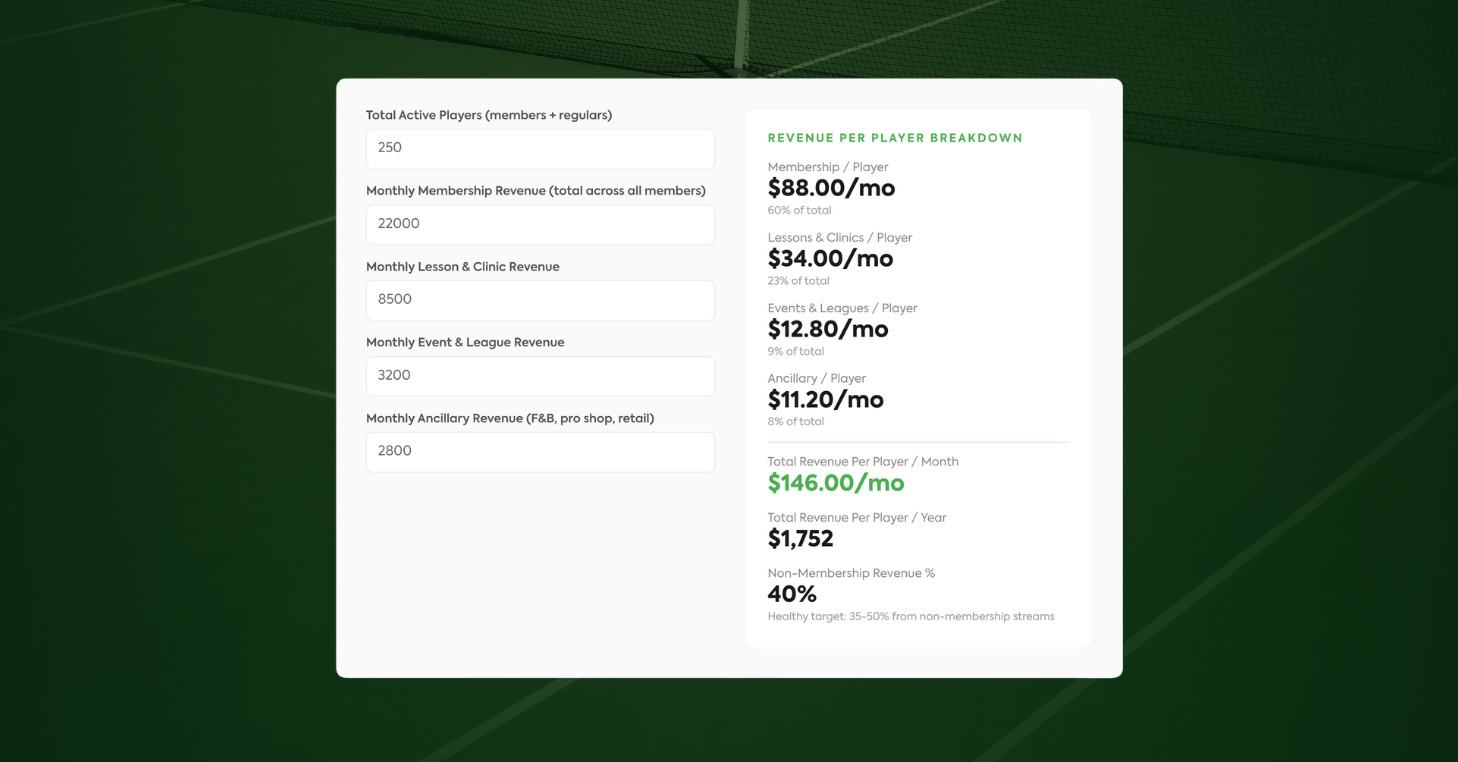
With the Revenue Per Player Calculator, you get a clear monthly and annual breakdown of what each player actually generates across all your streams. A club with a total Revenue Per Player of $180 a month operates very differently than one collecting $99 in membership fees and nothing else. Knowing that number changes how you think about marketing spend, programming investment, and pricing.
From what we see across active clubs on the platform, median total Revenue Per Player runs around $142 a month. If yours is below $100, events and lessons are almost always where the gap is.
Best for: Clubs that want to understand the full economic value of their player base and identify which revenue streams have the most room to grow.
6. Lesson & Clinic Pricing Calculator
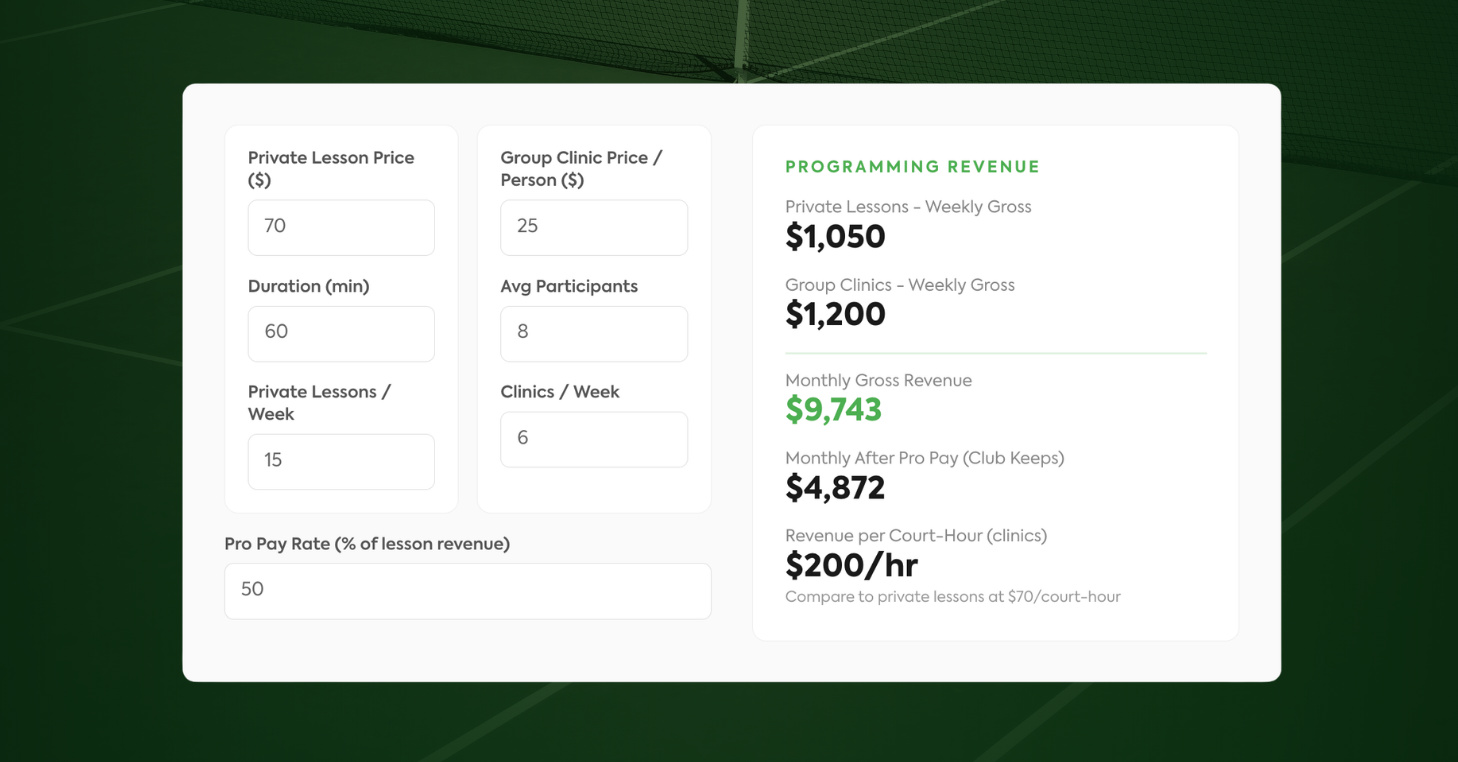
Not all programming is equally profitable. Private lessons feel premium, but a group clinic at $25 per person with eight participants generates nearly three times more revenue per court-hour. Yet clubs still fill their programming schedule with private lessons first.
Getting your schedule right starts with knowing what each format is actually worth to your club. Plug your rates, session frequency, and participant counts into the Lesson & Clinic Pricing Calculator, and you get a full breakdown of what each format actually nets after pro pay, including weekly gross, monthly net, and revenue per court-hour for both, side by side.
Among the 2,200+ facilities on CourtReserve, high-performing clubs run roughly 30–40% of programming hours on private lessons and 60–70% on group formats. This is the tool that shows whether your current mix is working for you or against you.
Best for: Clubs with active lesson and clinic programs who want to optimize their programming mix, and operators building out programming for the first time.
7. Court Utilization Planner
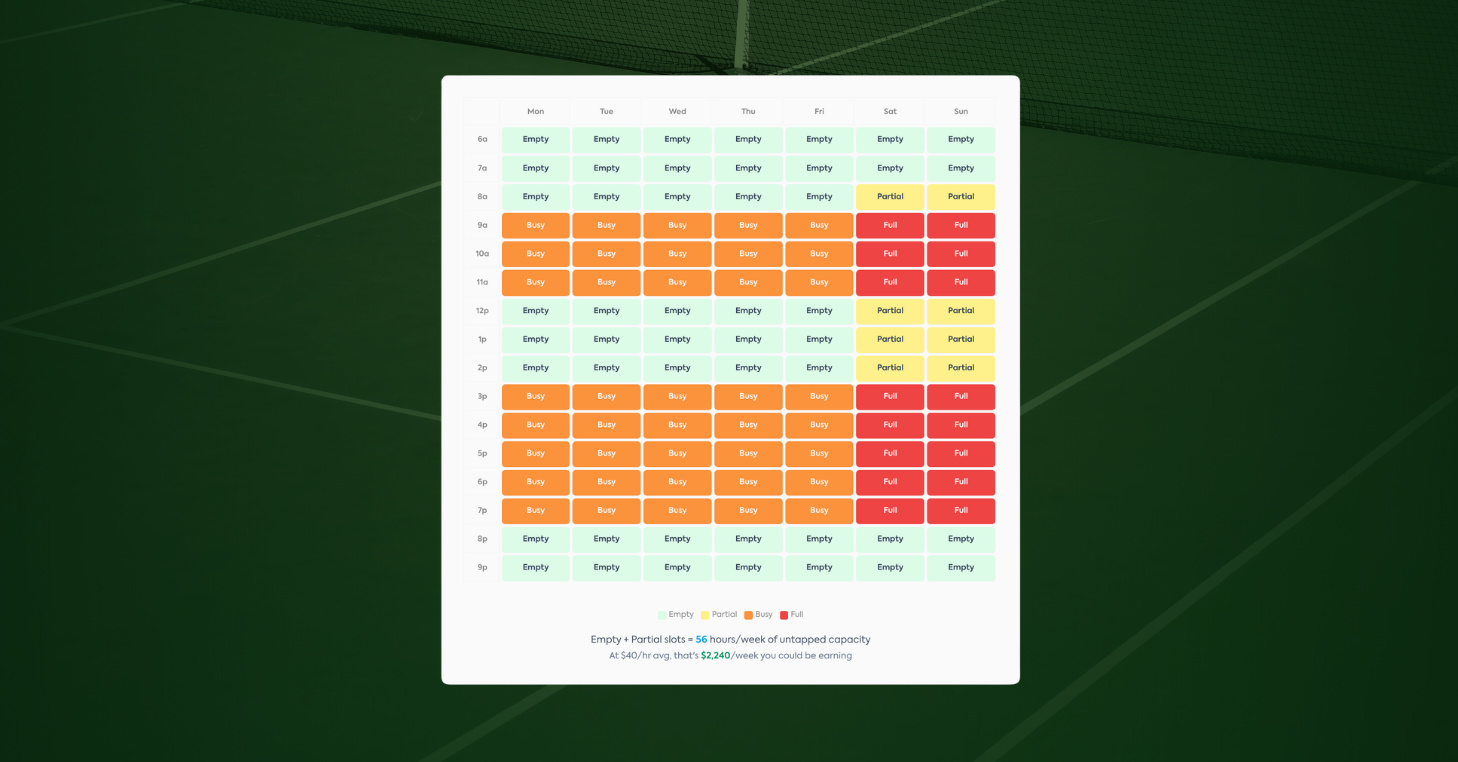
Empty court hours have a price tag. An 8-court facility with 30% off-peak utilization carries roughly 40–60 empty court-hours per week. At $40 per hour, that’s up to $2,400 weekly in revenue that’s available but not being captured.
Map your actual schedule in the Court Utilization Planner and mark each hour across the week as empty, partial, busy, or full. It calculates exactly how many hours of untapped capacity you have and what they’re worth. The output makes it easy to see where targeted programming or Public Booking would have the most impact.
Blended utilization rates don’t tell the full story. Evenings and weekends are almost always strong. The opportunity is in the quieter hours: early mornings, midday, and weekday afternoons, where the right programming can meaningfully change the weekly revenue picture.
Best for: Operators who want to see exactly where their courts are underperforming and quantify what closing that gap is worth.
8. Event & Tournament ROI Calculator
Events fill off-peak hours, drive food and beverage spend, and keep members engaged in a way that reduces churn. But before committing to a programming calendar, it’s worth knowing which formats generate the strongest return.
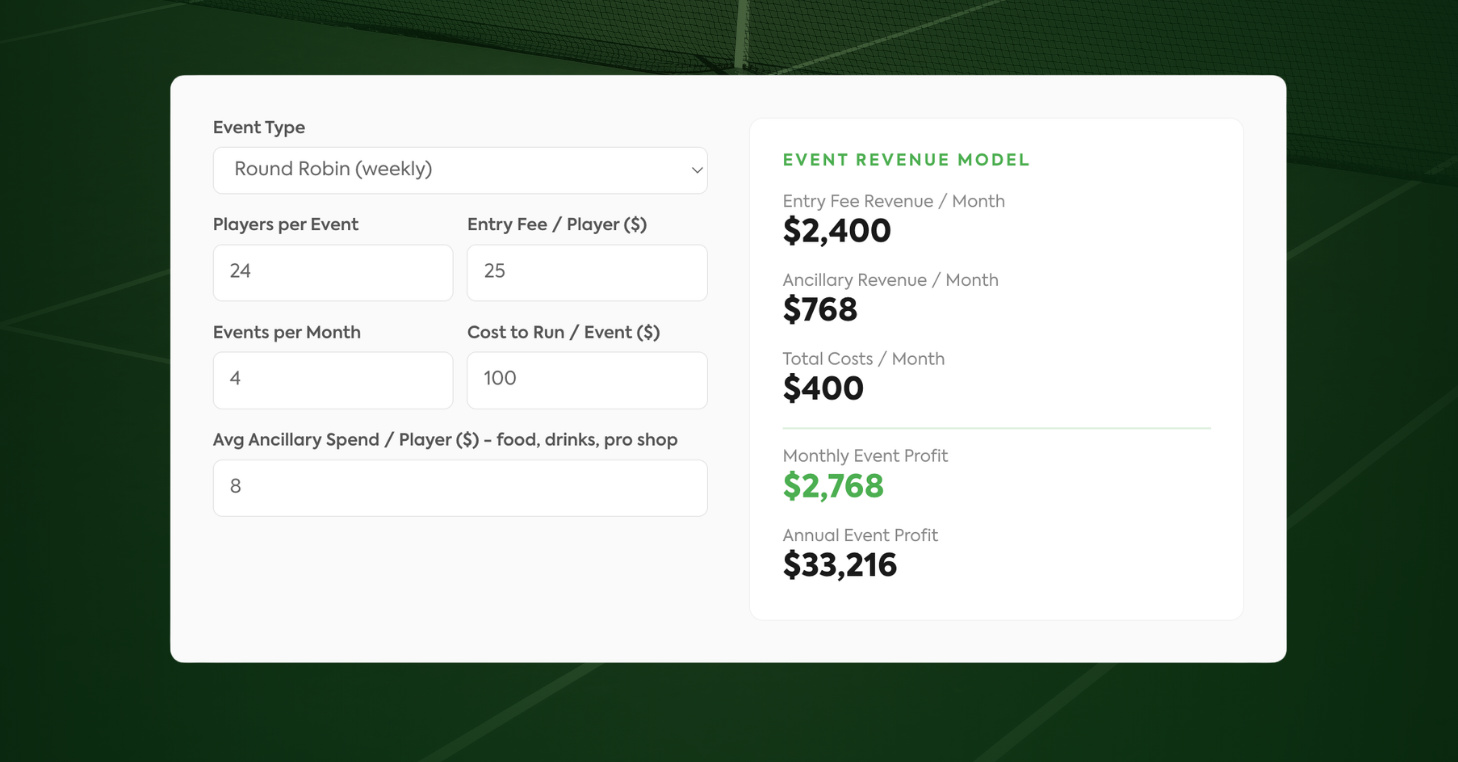
Run the numbers across every format with the Event & Tournament ROI Calculator. Enter entry fees, ancillary revenue, and run programming costs, and you get clear monthly and annual profit figures for round robins, leagues, tournaments, and clinics.
Weekly events and leagues tend to deliver the best return on effort. Tournaments generate more per event, but require more from the team. Knowing the numbers before building the schedule is what separates a purposeful programming calendar from one built on habit.
Best for: Clubs building out an events calendar and operators who want to build programming around formats that generate the strongest return.
9. Staffing Cost Calculator
Labor is the second-largest expense a racquet sports facility carries, right behind rent. Getting the headcount right, by role, by shift, by hourly rate, directly affects whether your business is sustainable.
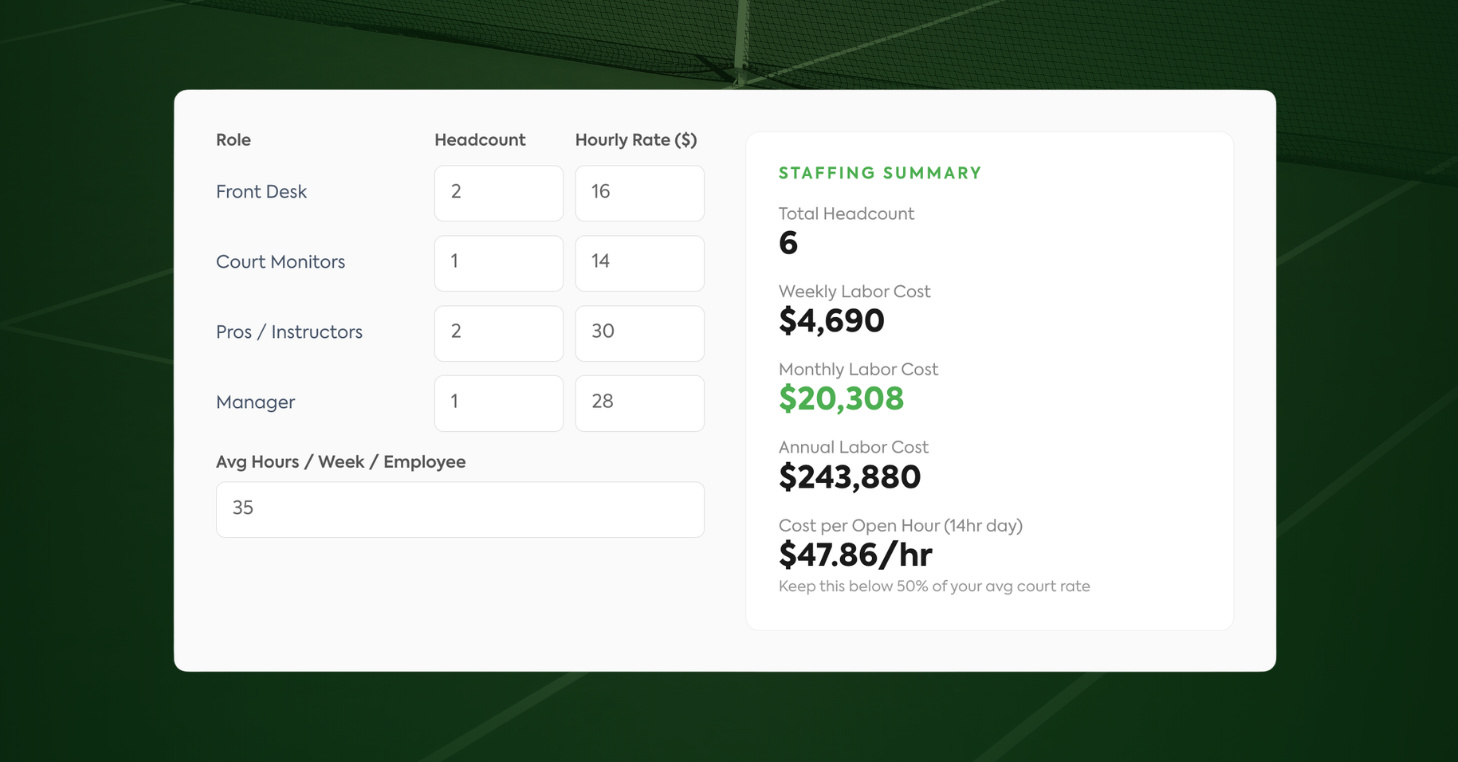
Because labor costs are variable and depend on headcount, hours, and rates, the right configuration looks different depending on facility size, programming, and how much of the operation is automated. You can find your optimal staffing setup with the Staffing Cost Calculator.
Drop in headcount and hourly rates across every role and get a full labor breakdown: weekly, monthly, and annual. That output sits alongside cost per open hour, the single metric that tells you whether the staffing model is sustainable relative to what your courts generate.
Typical rates across the CourtReserve network include:
- $14–$18 for front desk
- $12–$16 for court monitors
- $25–$45 for teaching pros
For operators planning a hire or stress-testing a labor budget, those benchmarks are a useful place to start before the decision is made.
Best for: Clubs planning a new hire, operators building a labor budget, and any facility that wants a clearer picture of what staffing is actually costing per hour of operation.
10. Membership Growth Projector
Reducing churn by 1% is often worth more than adding five new members a month. Retained members compound, as every member who stays this month pays next month too, and the month after. That math adds up faster than most growth initiatives.
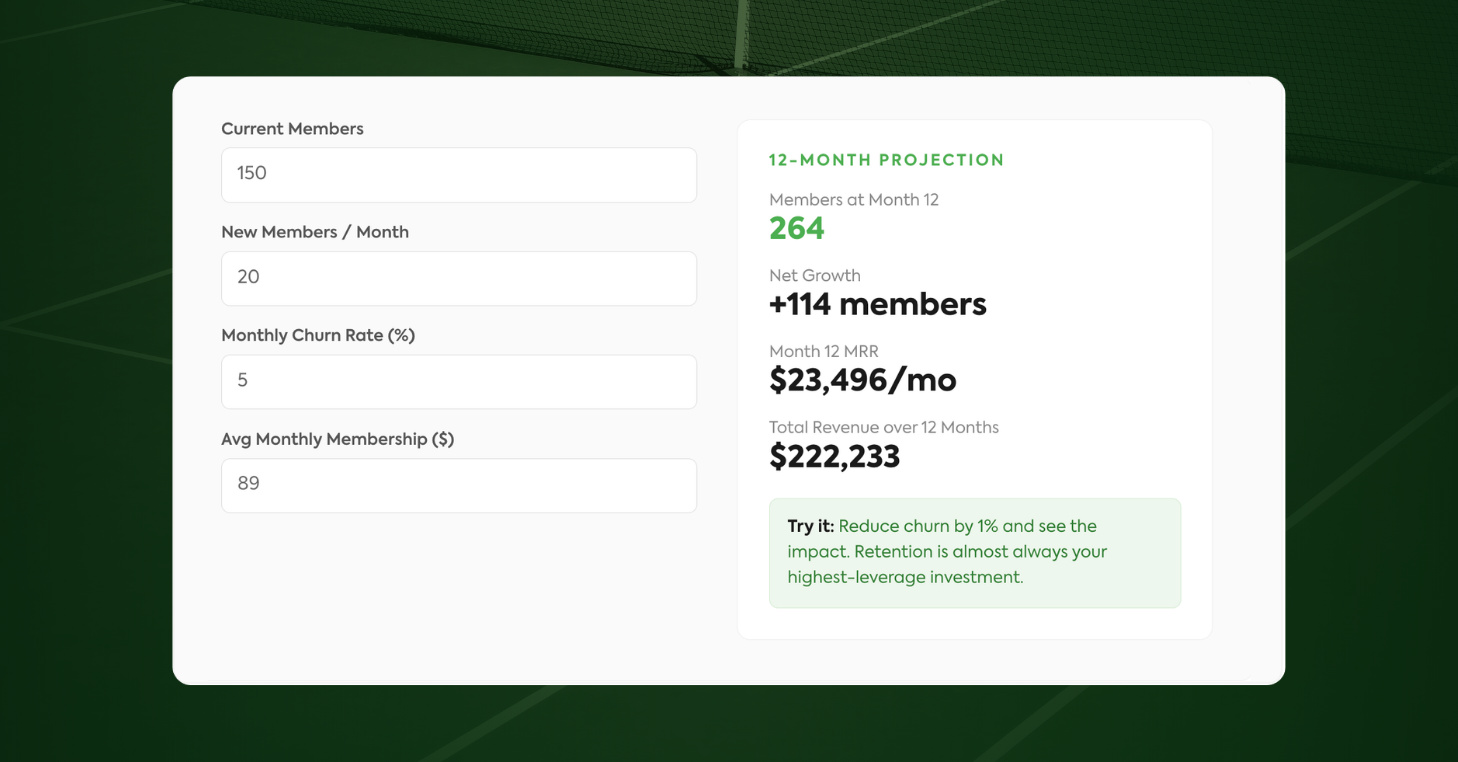
That’s where the Membership Growth Projector comes in. Enter your current member count, monthly sign-ups, churn rate, and average membership price, and you get a full 12-month picture: where your membership count lands, what your monthly recurring revenue looks like, and what the year generates in total.
Once your baseline is set, the real value is in the what-ifs. Nudge churn down a point, bump up sign-ups, and see how the 12-month trajectory responds. The lever that moves the number most is usually the one worth investing in first.
Best for: Clubs setting 12-month growth targets and operators who want to understand what retention is actually worth before deciding where to invest next.
11. Club Growth Facility Scorecard
One underperforming area can slow an entire operation. The hard part is knowing which one it is.
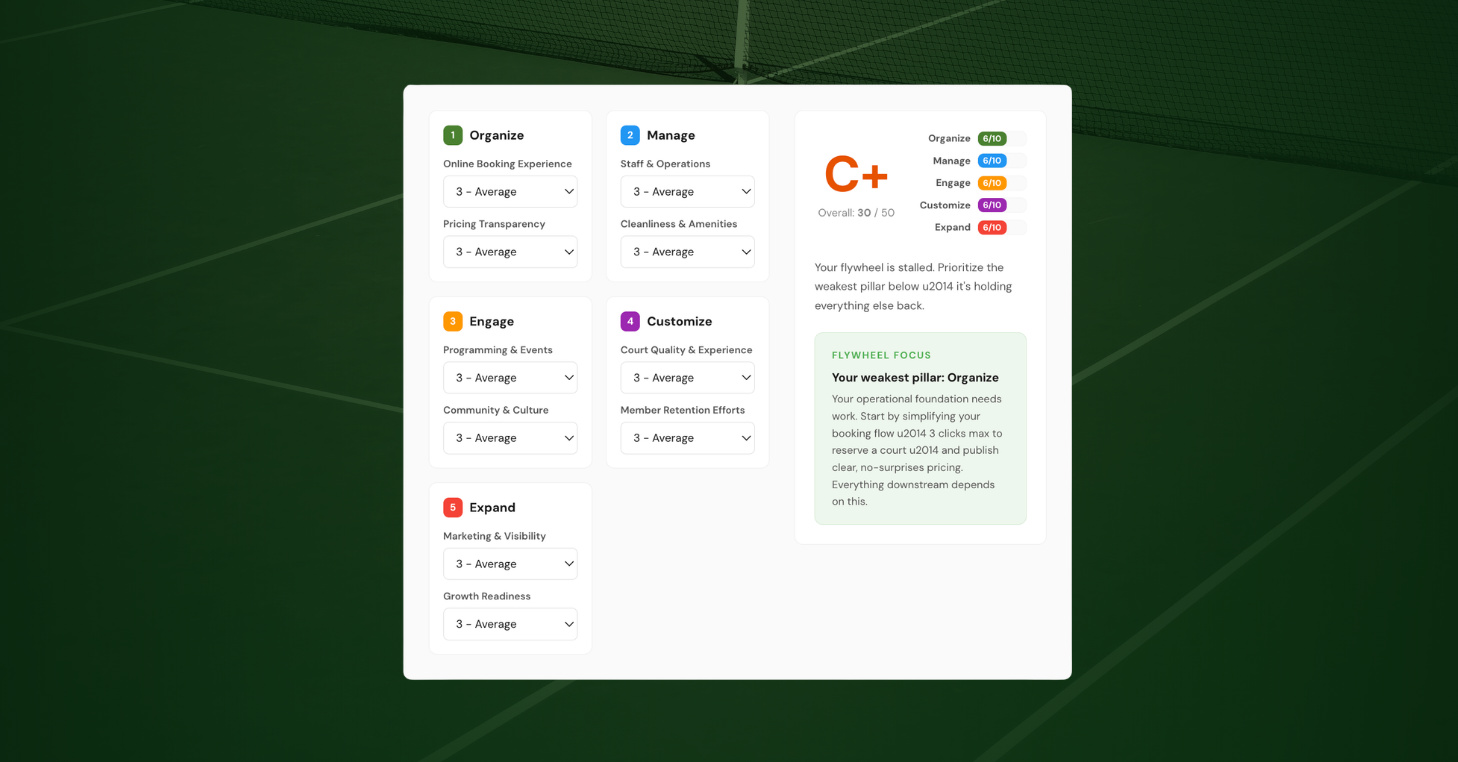
Finding your club’s biggest bottleneck takes about 90 seconds with the Facility Scorecard. Ten questions across five areas of club operations: bookings, management, engagement, experience, and growth. An honest set of answers produces a health grade for each area and specific advice on where to focus first.
The scorecard is built on CourtReserve’s Club Growth Flywheel and the idea that fixing your weakest area amplifies every other part of the operation. Great programming doesn’t retain members if booking is a friction point. Strong engagement doesn’t drive growth if visibility is low. The scorecard shows you where you’re losing momentum and how to fix it.
Best for: Any operator who wants an honest, structured read on the health of their operation, regardless of club size or stage of growth.
12. New Club Launch Checklist
From business plan to grand opening, there are more decisions involved in launching a new club than you might expect going in.
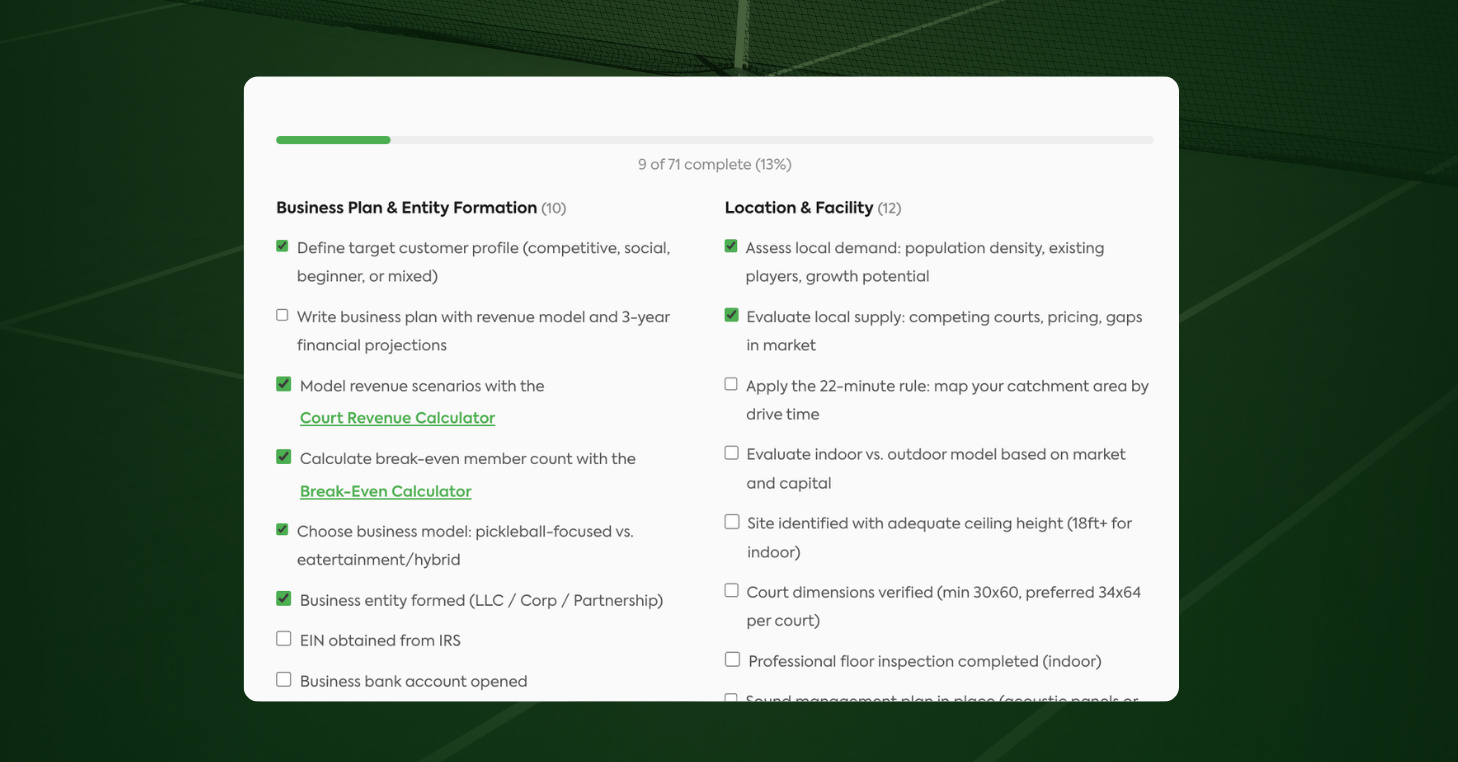
The New Club Launch Checklist organizes the entire process into 60 steps across eight categories: business plan, site selection, construction, permitting, staffing, software setup, pre-launch marketing, and grand opening.
It’s interactive, so operators can check items off as they go, track overall progress, and link directly to the calculators that handle the financial modeling behind each phase. The checklist won’t prevent every setback, but it’s a faster way to catch what’s been missed before it costs months.
Best for: Operators planning a new club or second location who want a structured framework instead of starting from a blank page.
Start with the numbers that matter most to you
Every club is at a different stage. Some are pre-launch. Some are optimizing a mature membership base. Some are trying to figure out why growth has stalled.
Start with the tools that match the decision you’re already thinking about or the question you haven’t been able to answer cleanly. And if you’re still unsure, run the Facility Scorecard first. It grades your operation across five areas and points you toward the tools that will have the most impact for your club specifically.
All 12 are free, no account required, and available at courtreserve.com/free-tools.