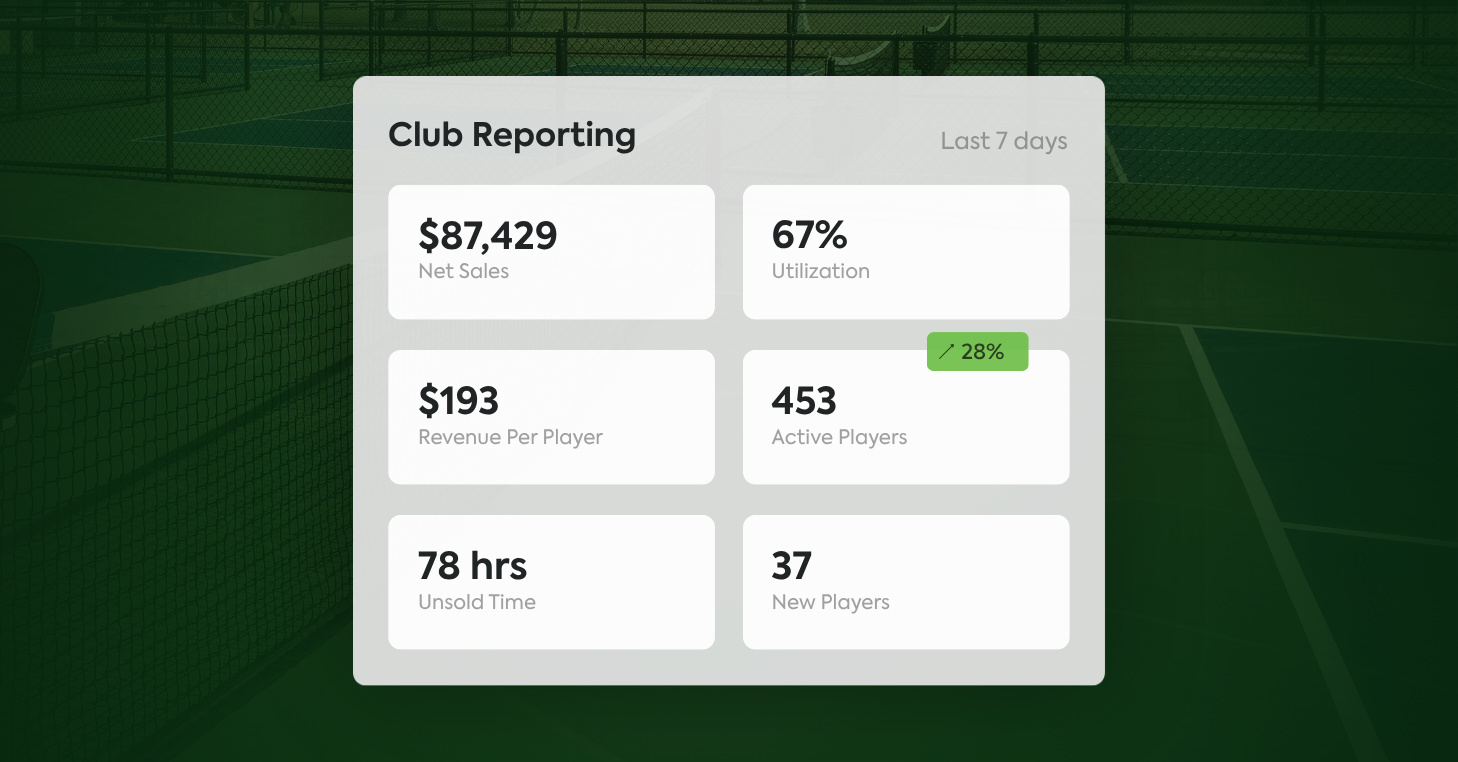
CourtReserve Pulse is a built-in reporting dashboard that brings your club’s most important numbers into one view: financials, court usage, member engagement, player demographics, and instructor activity.
Each key metric shows a period-over-period comparison, refreshed every night, so you can tell a real trend from a normal week. Open it from your admin panel and immediately see where your club stands. No reports to run, no spreadsheet to reconcile.
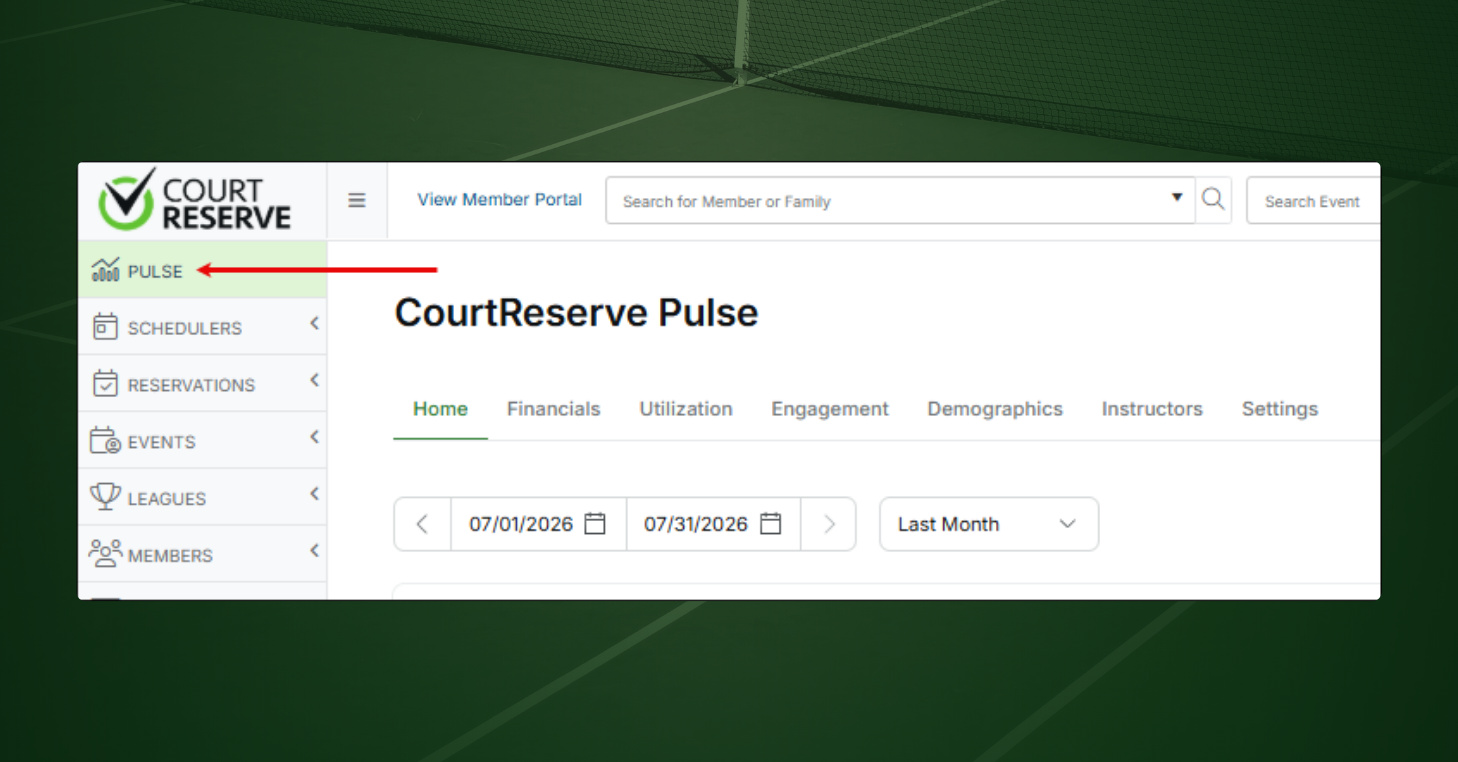
Pulse is included at no extra cost for most CourtReserve clubs — whether you run one location or many. If you’re on an older plan and don’t see it yet, reach out and we’ll get you set up. See how it works in the Pulse overview guide.
Your racquet club’s performance, in one place
You’re already generating the data. Every booking, payment, cancellation, and new player leaves a trail inside CourtReserve. The numbers were never the problem. They just sat scattered across separate reports, waiting for someone to go dig them out.
Pulse pulls all of your club’s data into one up-to-date view automatically. For the first time, the full state of your club is right there in front of you. You can see what’s growing, what’s slipping, and where revenue is actually coming from, without piecing a single report together. It’s your club’s health at a glance.
The calls that move your bottom line stop being made in the dark. What used to ride on instinct now rides on evidence. Clarity like that pays off over time: better decisions, made sooner, season after season.
What does Pulse tell you about your racquet and paddle club?
Pulse opens on a Home tab that sums up your whole club, then breaks the detail into five areas: revenue, court utilization, member engagement, player demographics, and instructor activity.
Each one answers a different question about how your club is doing, and together they give you the full performance picture.
Here’s what each view covers, and the decisions they can help you make.
Jump ahead here:
Financials tab
Utilization tab
Engagement tab
Demographics tab
Instructors tab
Home: Get an instant read on your entire operation
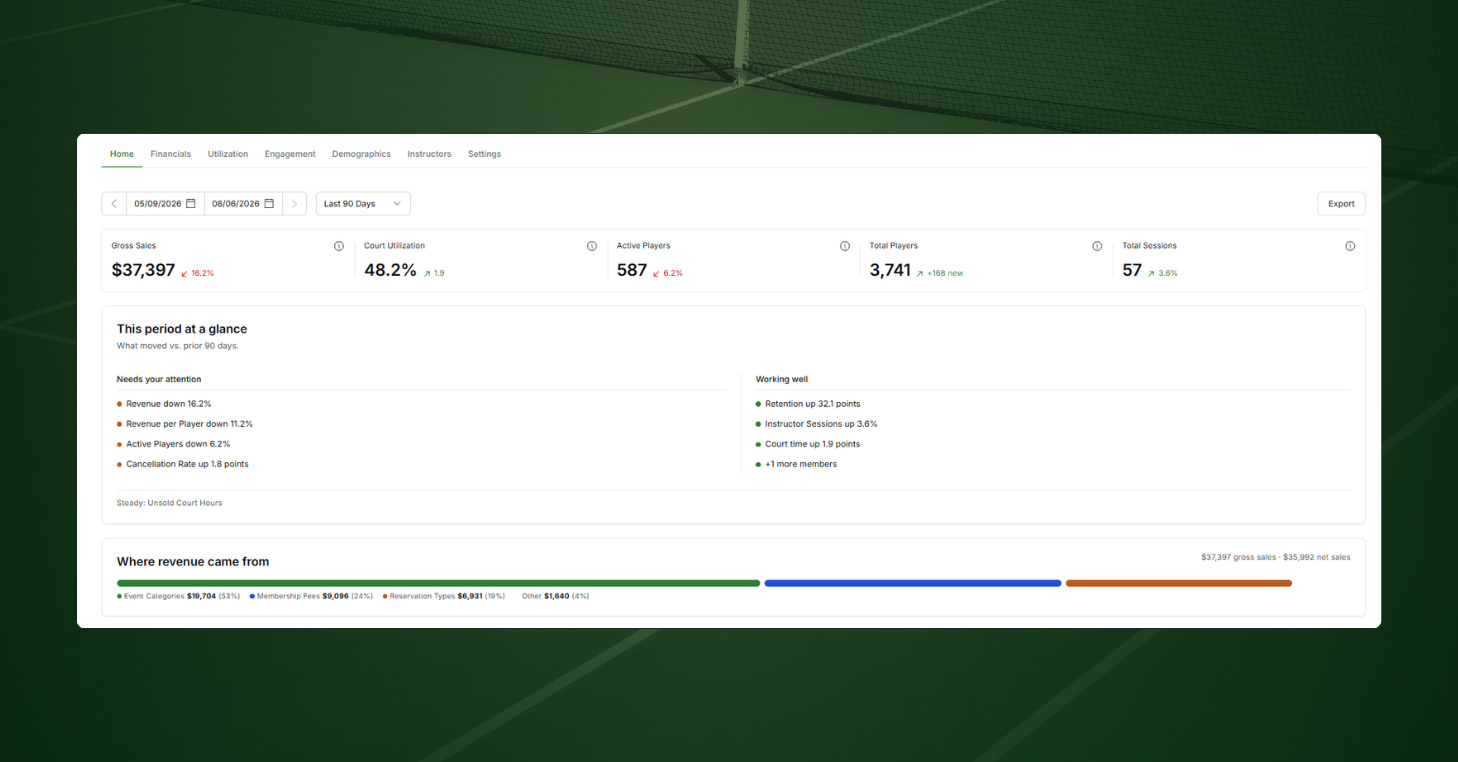
The Home tab gives you the fastest read on your club you’ve ever had inside CourtReserve.
It brings the top metrics from every tab into one view for an overview of your club’s performance across sales, utilization, players, and more. This tab also flags recent changes worth noting, sorted into three groups:
- Needs your attention: metrics moving the wrong way
- Working well: the wins worth noting
- Steady: metrics with no significant change
Now you’ve got a full read on your club’s entire operation in the time it used to take to open a single report. And when you want to dig deeper, the individual Pulse tabs have the full detail.
Financials: Know your revenue before the month ends
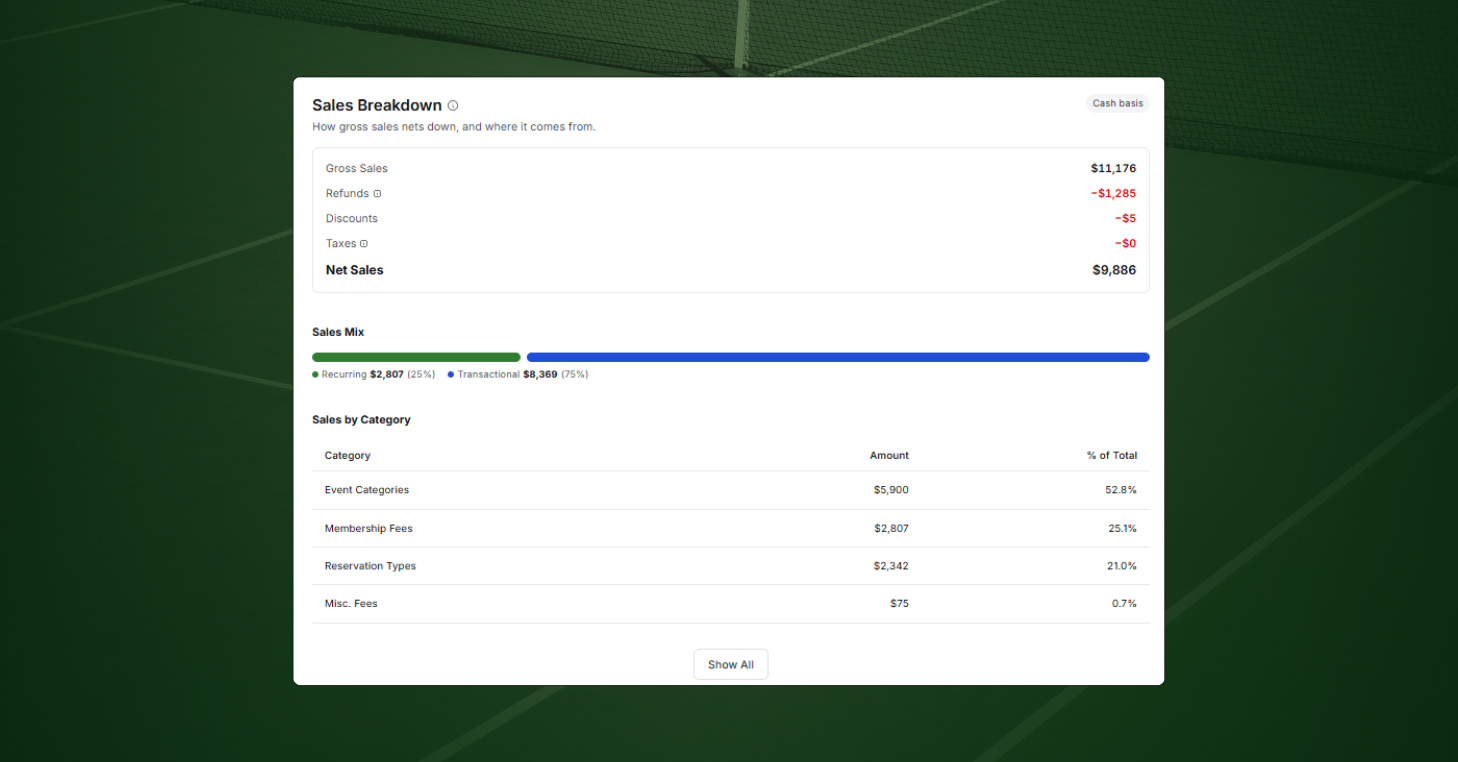
What’s coming in, and from where? The Financials tab answers both, starting with five metrics that give you the state of your revenue at a glance:
- Gross sales: total collected in the period
- Total payment volume: total processed across all payment methods
- Revenue per player: average revenue per active player
- Refunds and discounts: total issued in the period
- Outstanding invoices: total unpaid member balances
From there, you can go deeper. See how much of your income is recurring membership revenue versus one-off transactions, then break it down by source: memberships, events, reservations, packages, and point of sale.
That’s how you catch a slipping revenue category while there’s still time to fix it.
Utilization: Find the gaps in your schedule
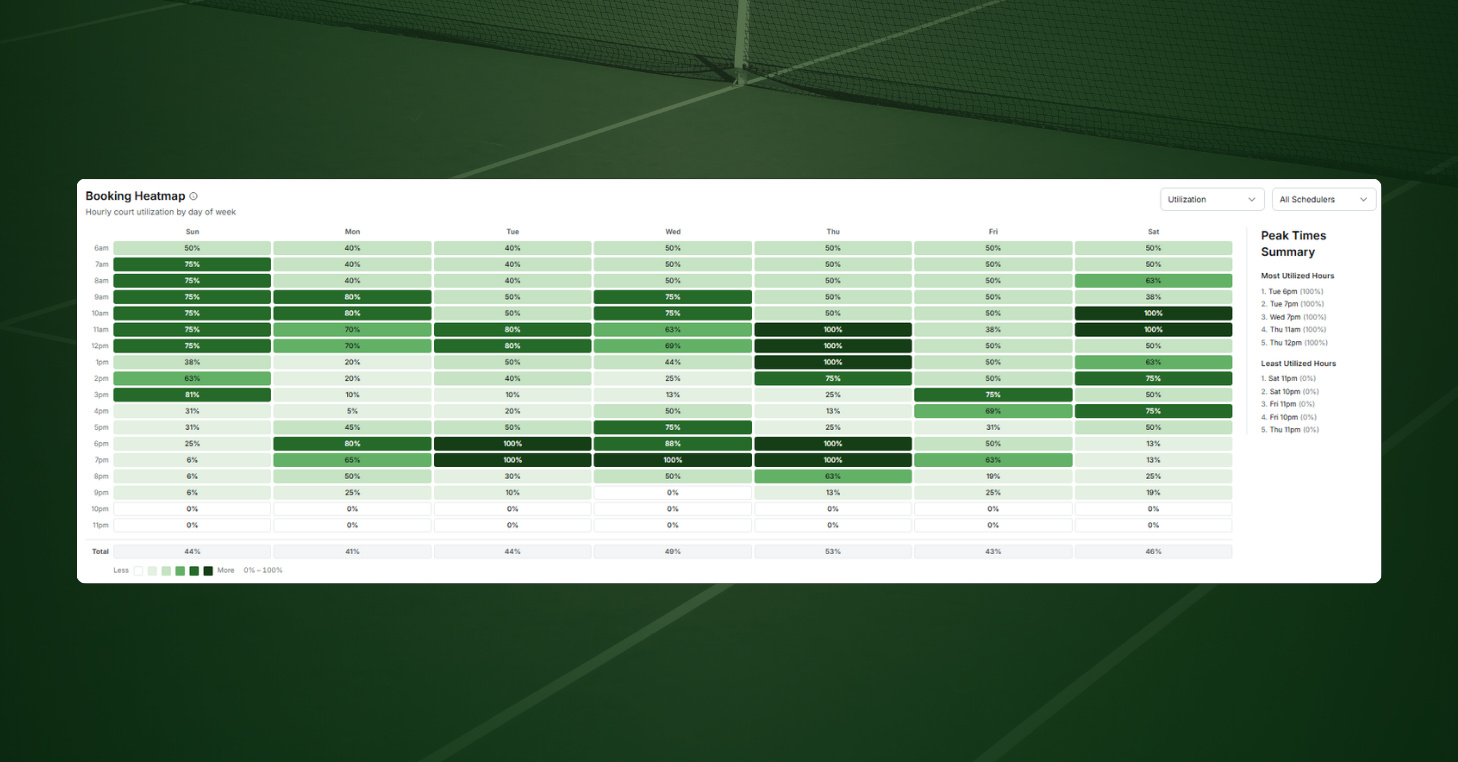
Empty courts are lost revenue you can’t get back. The Utilization tab shows you exactly when and where capacity is going unfilled by displaying:
- Court utilization: share of available court hours that were booked
- Average bookings per court, per day: how hard each court is working
- Available hours unsold: bookable court time that went empty
- Cancellation rate: share of bookings that were cancelled
- Booking Heatmap: the whole week laid out hour by hour, busy stretches and quiet ones
- Peak Times Summary: your busiest and slowest slots, ranked
- Court performance: each court ranked by the revenue it brings in
With all of this in one place, you can find a slow window worth filling, shift pricing to pull demand into quiet hours, or make the case for changing a cancellation policy that’s costing you.
Engagement: See whether your membership is growing or slipping
Keeping a member costs far less than winning a new one, and the warning signs usually show up well before anyone cancels. The Engagement tab tracks the health of your membership and your wider player base side by side with data snapshots of:
- Active members: paying members at the close of the period
- Member retention: share of members who stuck with you through the period
- Avg. activities per member: how often your paying members are booking, on average
- Member growth rate: new members added, against the size of your base
- Active players: everyone who played, members and non-members alike
- Repeat booking rate: share of this period’s players who were also booking with you last period
- Avg. activities per player: how often everyone, member or not, is booking, on average
- New players: players who booked with you for the first time
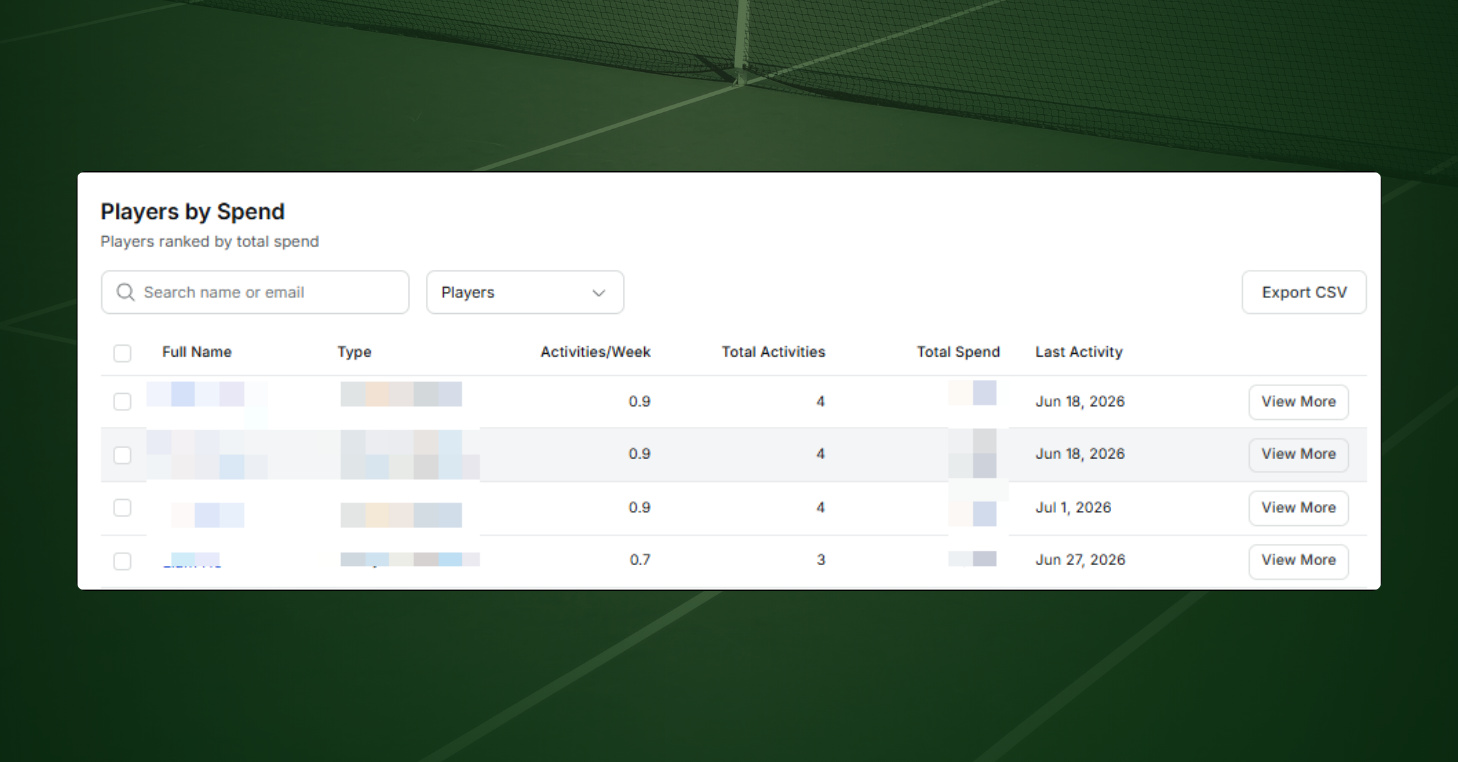
These numbers tell you whether the base is growing or slipping. The Players by Spend table tells you what to do about it. Ranked by spend, it shows your most engaged, highest-value players at the top.
And if you switch to the Inactive Members view, you’ll see paying members who’ve gone quiet, flagged by risk, renewal date, and monthly value. So when someone’s activity drops off, you can reach out before they drift away, right from the dashboard.
Demographics: Instantly understand your player base
Programming, marketing, and communication land better when they fit the people who actually show up and play at your club. Here’s how the Demographics tab gives you a read on your full player base:
- Total players: everyone who holds an account at your club
- Median age: the age your player base centers on
- Median skill rating: where your players sit on skill, DUPR or your own rating system
- Gender split: the balance of male and female players
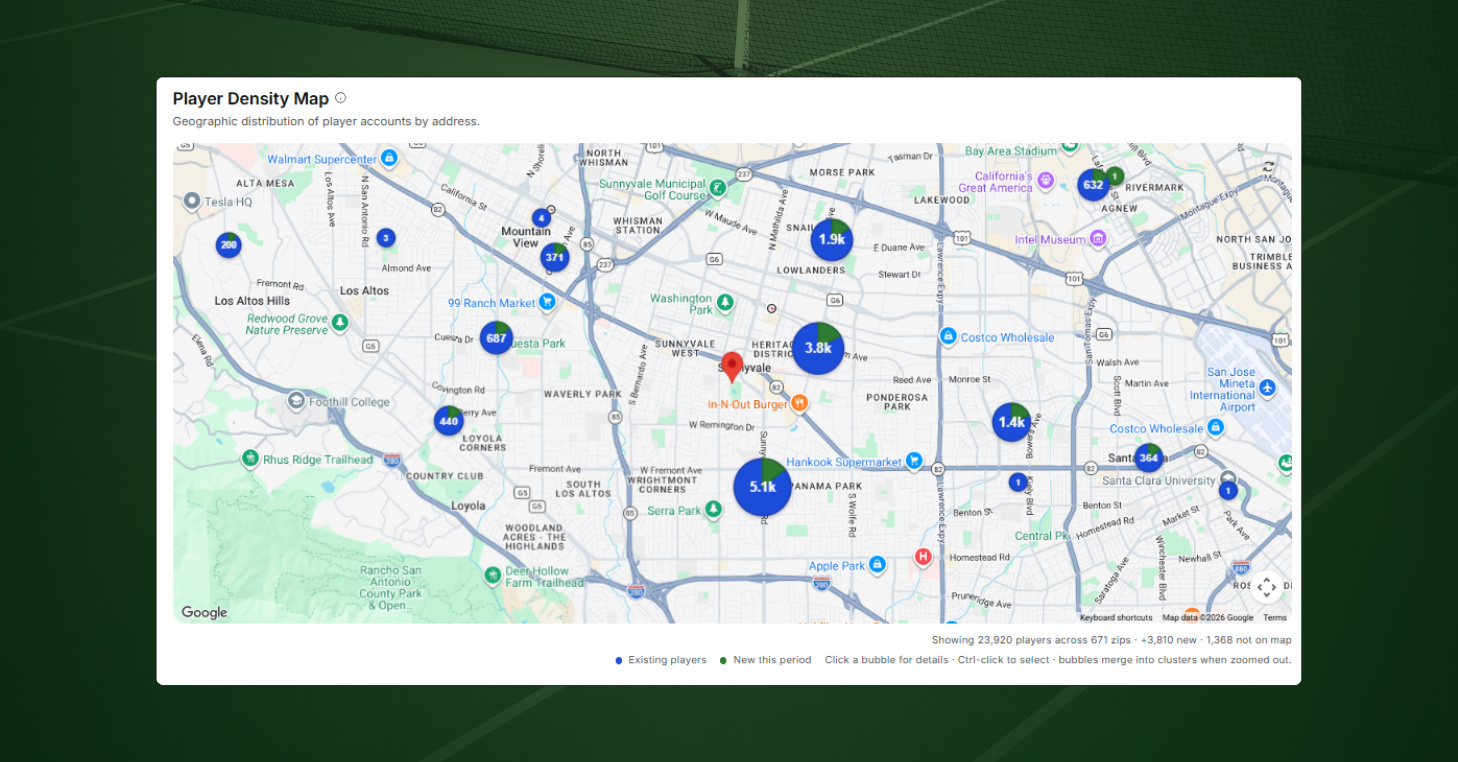
- Player density map: where your players live, with the top zip codes ranked by size and recent growth
Every view here is built to act on. Click into a skill range, an age group, or a zip code, and you’ve got that group ready to email or text. Now your marketing spend and program schedules can follow the growth opportunities.
Instructors: Unlock more from your teaching staff
Your teaching staff drives both revenue and member experience, but their performance is hard to compare when it’s scattered across lesson, event, and reservation records. The Instructors tab pulls it altogether:
- Total sessions: how much teaching happened across the period
- Total revenue: what your private lessons brought in
- Utilization rate: how much of your instructors’ available time got booked
- Unique players: how many different members took a session
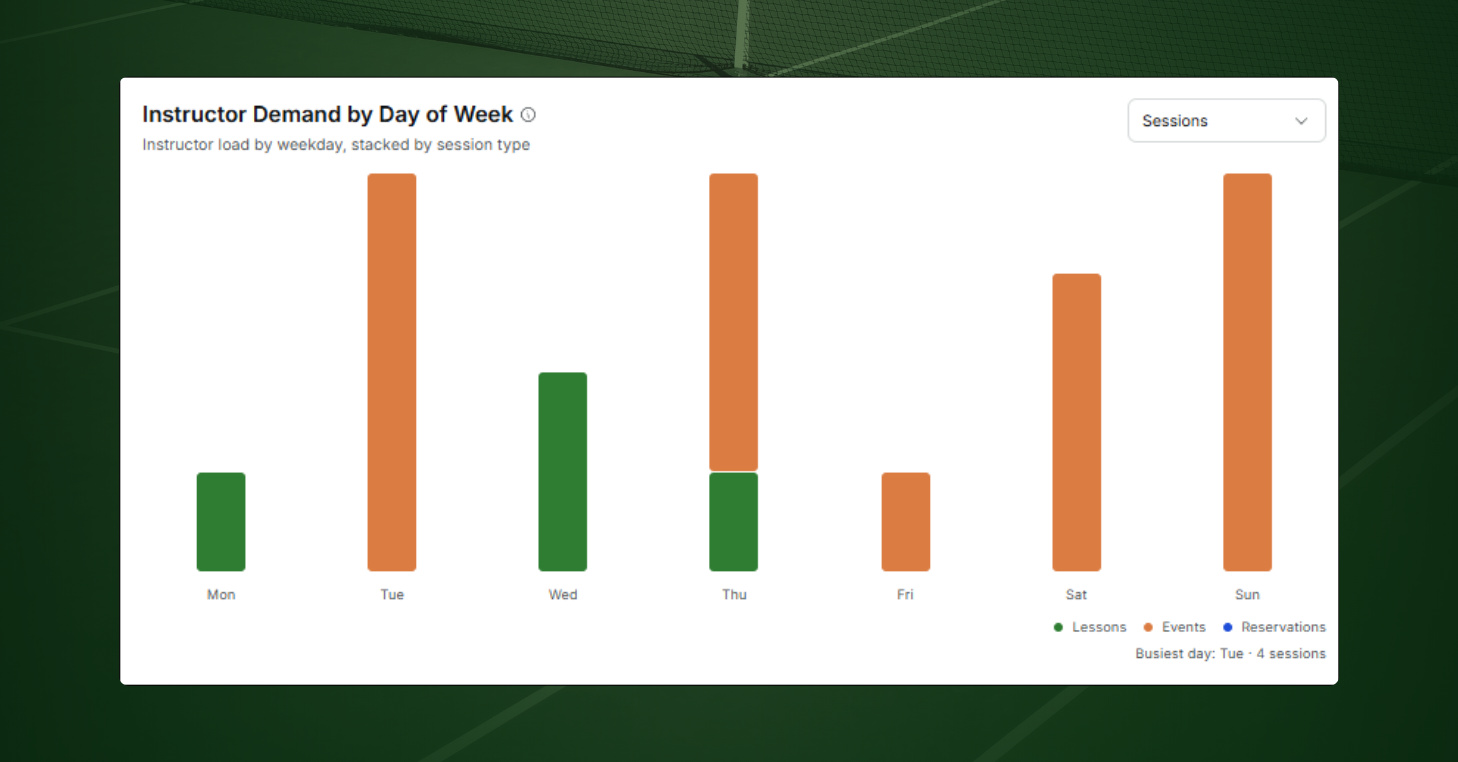
- Demand by day of week: see when teaching is concentrated and when it’s thin
- Session mix: how instructor time splits between lessons and events
The heart of the tab is a side-by-side ranking of every instructor by hours, utilization, and revenue. Who’s booked solid, who has room to take on more, and who’s driving the most revenue is all right there. This way, scheduling, pay, and development conversations start from the same set of facts.
Reporting that fits how your racquet sports club runs
A single number tells you where you are. Pulse shows you where you’re heading.
With CourtReserve Pulse, every metric is measured against the period before it, so you see movement, not just a total: revenue up 8% on the month, utilization slipping three weeks running, retention holding steady.
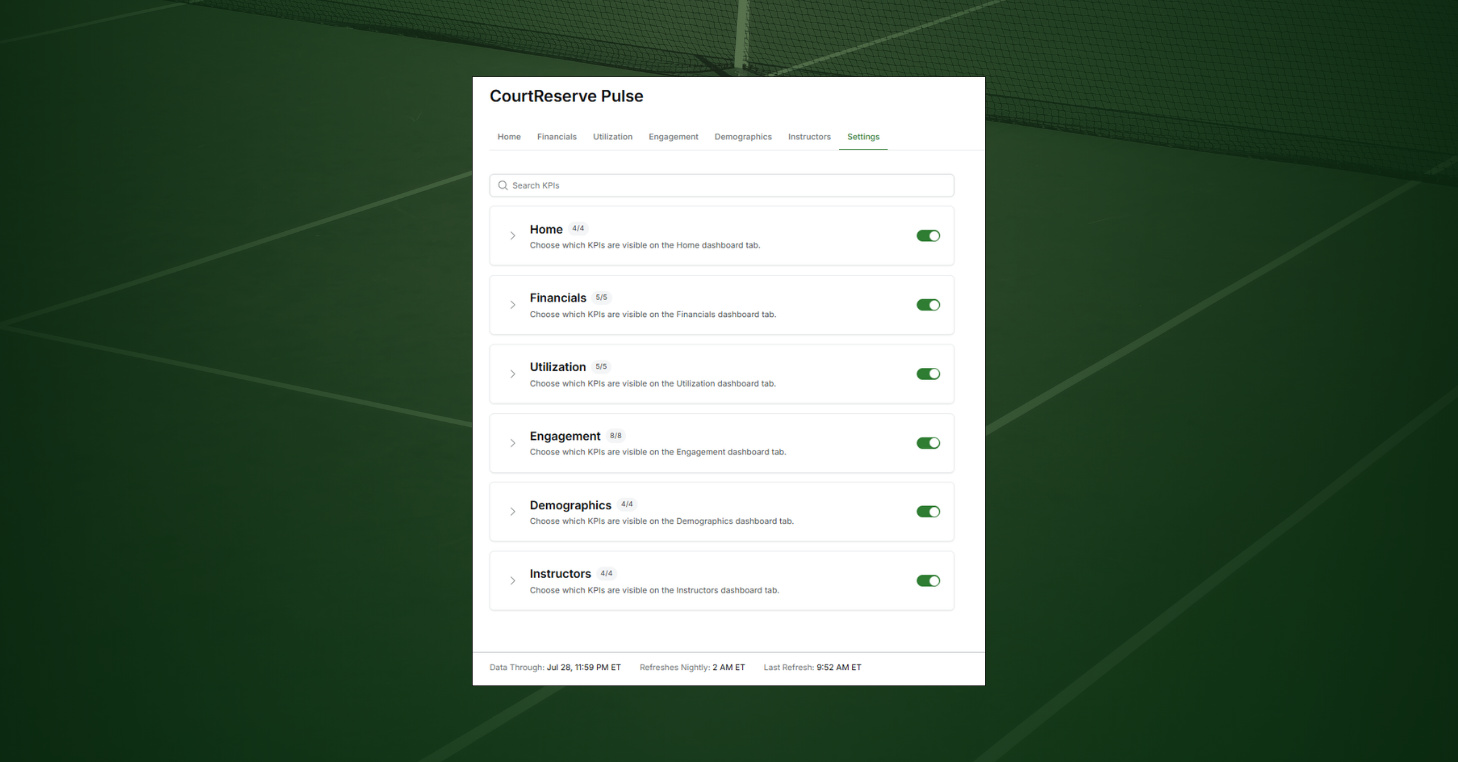
Set the date range once and all six tabs reflect that time period, so you can pull back to last quarter or zoom in on last week. When you spot something worth sharing, you can export any tab as a print-ready PDF or download the raw data as a CSV. And if a tab or a metric doesn’t apply to your club, switch it off in the Settings tab and keep your dashboard view clean and focused.
However you set it up, you’re always working from current data. Data refreshes nightly at 2 AM ET, with the exact cutoff shown in the footer.
Do a Pulse-check on your club operations
You’ve always had the instincts to run a great club. Now you’ve got the data to back them, in one place, current, and ready when you need it. Fewer guesses, clearer decisions, and a real read on where you’re headed from the first time you open it.
The next time someone asks how the month is going, you won’t have to reach for a spreadsheet. You’ll open Pulse.
Not yet on CourtReserve? Schedule a call with our team and we’ll walk you through it.
And see the dashboard in action at courtreserve.com/reporting
Frequently Asked Questions (FAQs)
What is CourtReserve Pulse?
Pulse is a built-in reporting and analytics dashboard inside CourtReserve. It brings your club’s revenue, court utilization, member engagement, player demographics, and instructor activity into one view, with period-over-period comparisons on every metric.
How much does CourtReserve Pulse cost?
Pulse is included at no extra cost for clubs except those on Legacy pricing plans. There are no add-on fees or per-report charges. If you are on older Legacy pricing plans you can request to move to a current plan and get access.
What can I track with Pulse?
Pulse covers six tabs. A Home tab gives you the overview, and five detail tabs go deep on financials, court utilization, member engagement, player demographics, and instructor activity. Every metric includes a period-over-period comparison, so you can see which way things are trending. New metrics and views are added over time.
Can I customize what I see?
Yes. The Settings tab lets you turn individual tabs on or off and choose which metrics show within each one, so your dashboard reflects what matters to your club.
Can I share Pulse with my staff or board?
Yes. You can export any tab as a print-ready PDF or download the raw data as a CSV. You can also give sub-admins access to specific tabs, so your front desk can see court usage without seeing your financials.
Do I need to set anything up?
No. Pulse pulls from the data your club already generates in CourtReserve, so there’s nothing to configure. Admins have access by default, from the Pulse link in the left navigation. The data refreshes nightly at 2 AM ET.
Does Pulse work for multi-location clubs?
Yes. Pulse works for single-location clubs and multi-location networks alike.